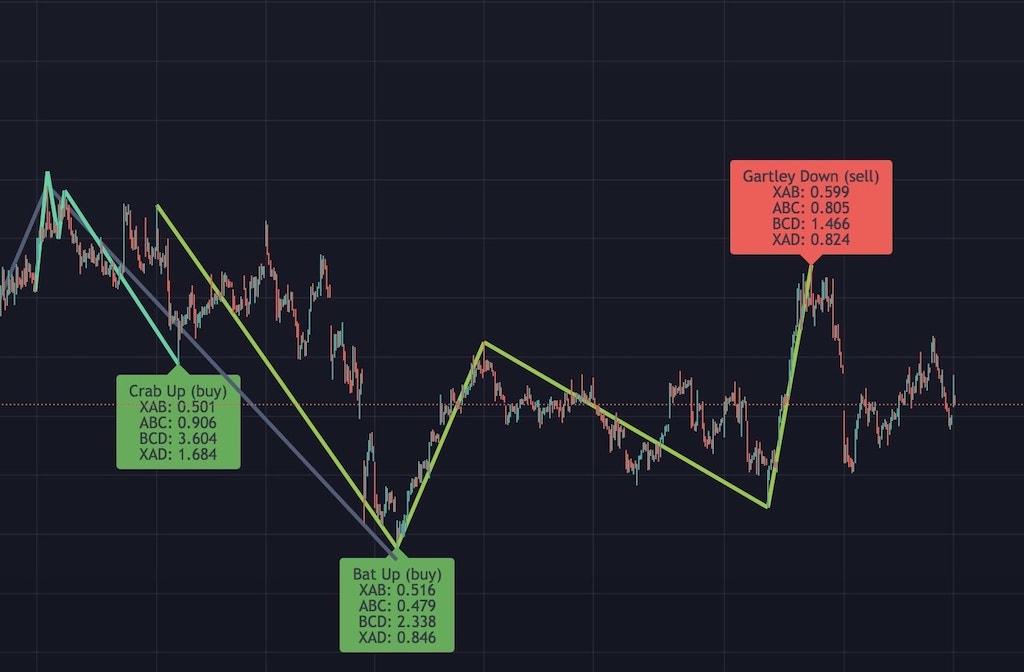
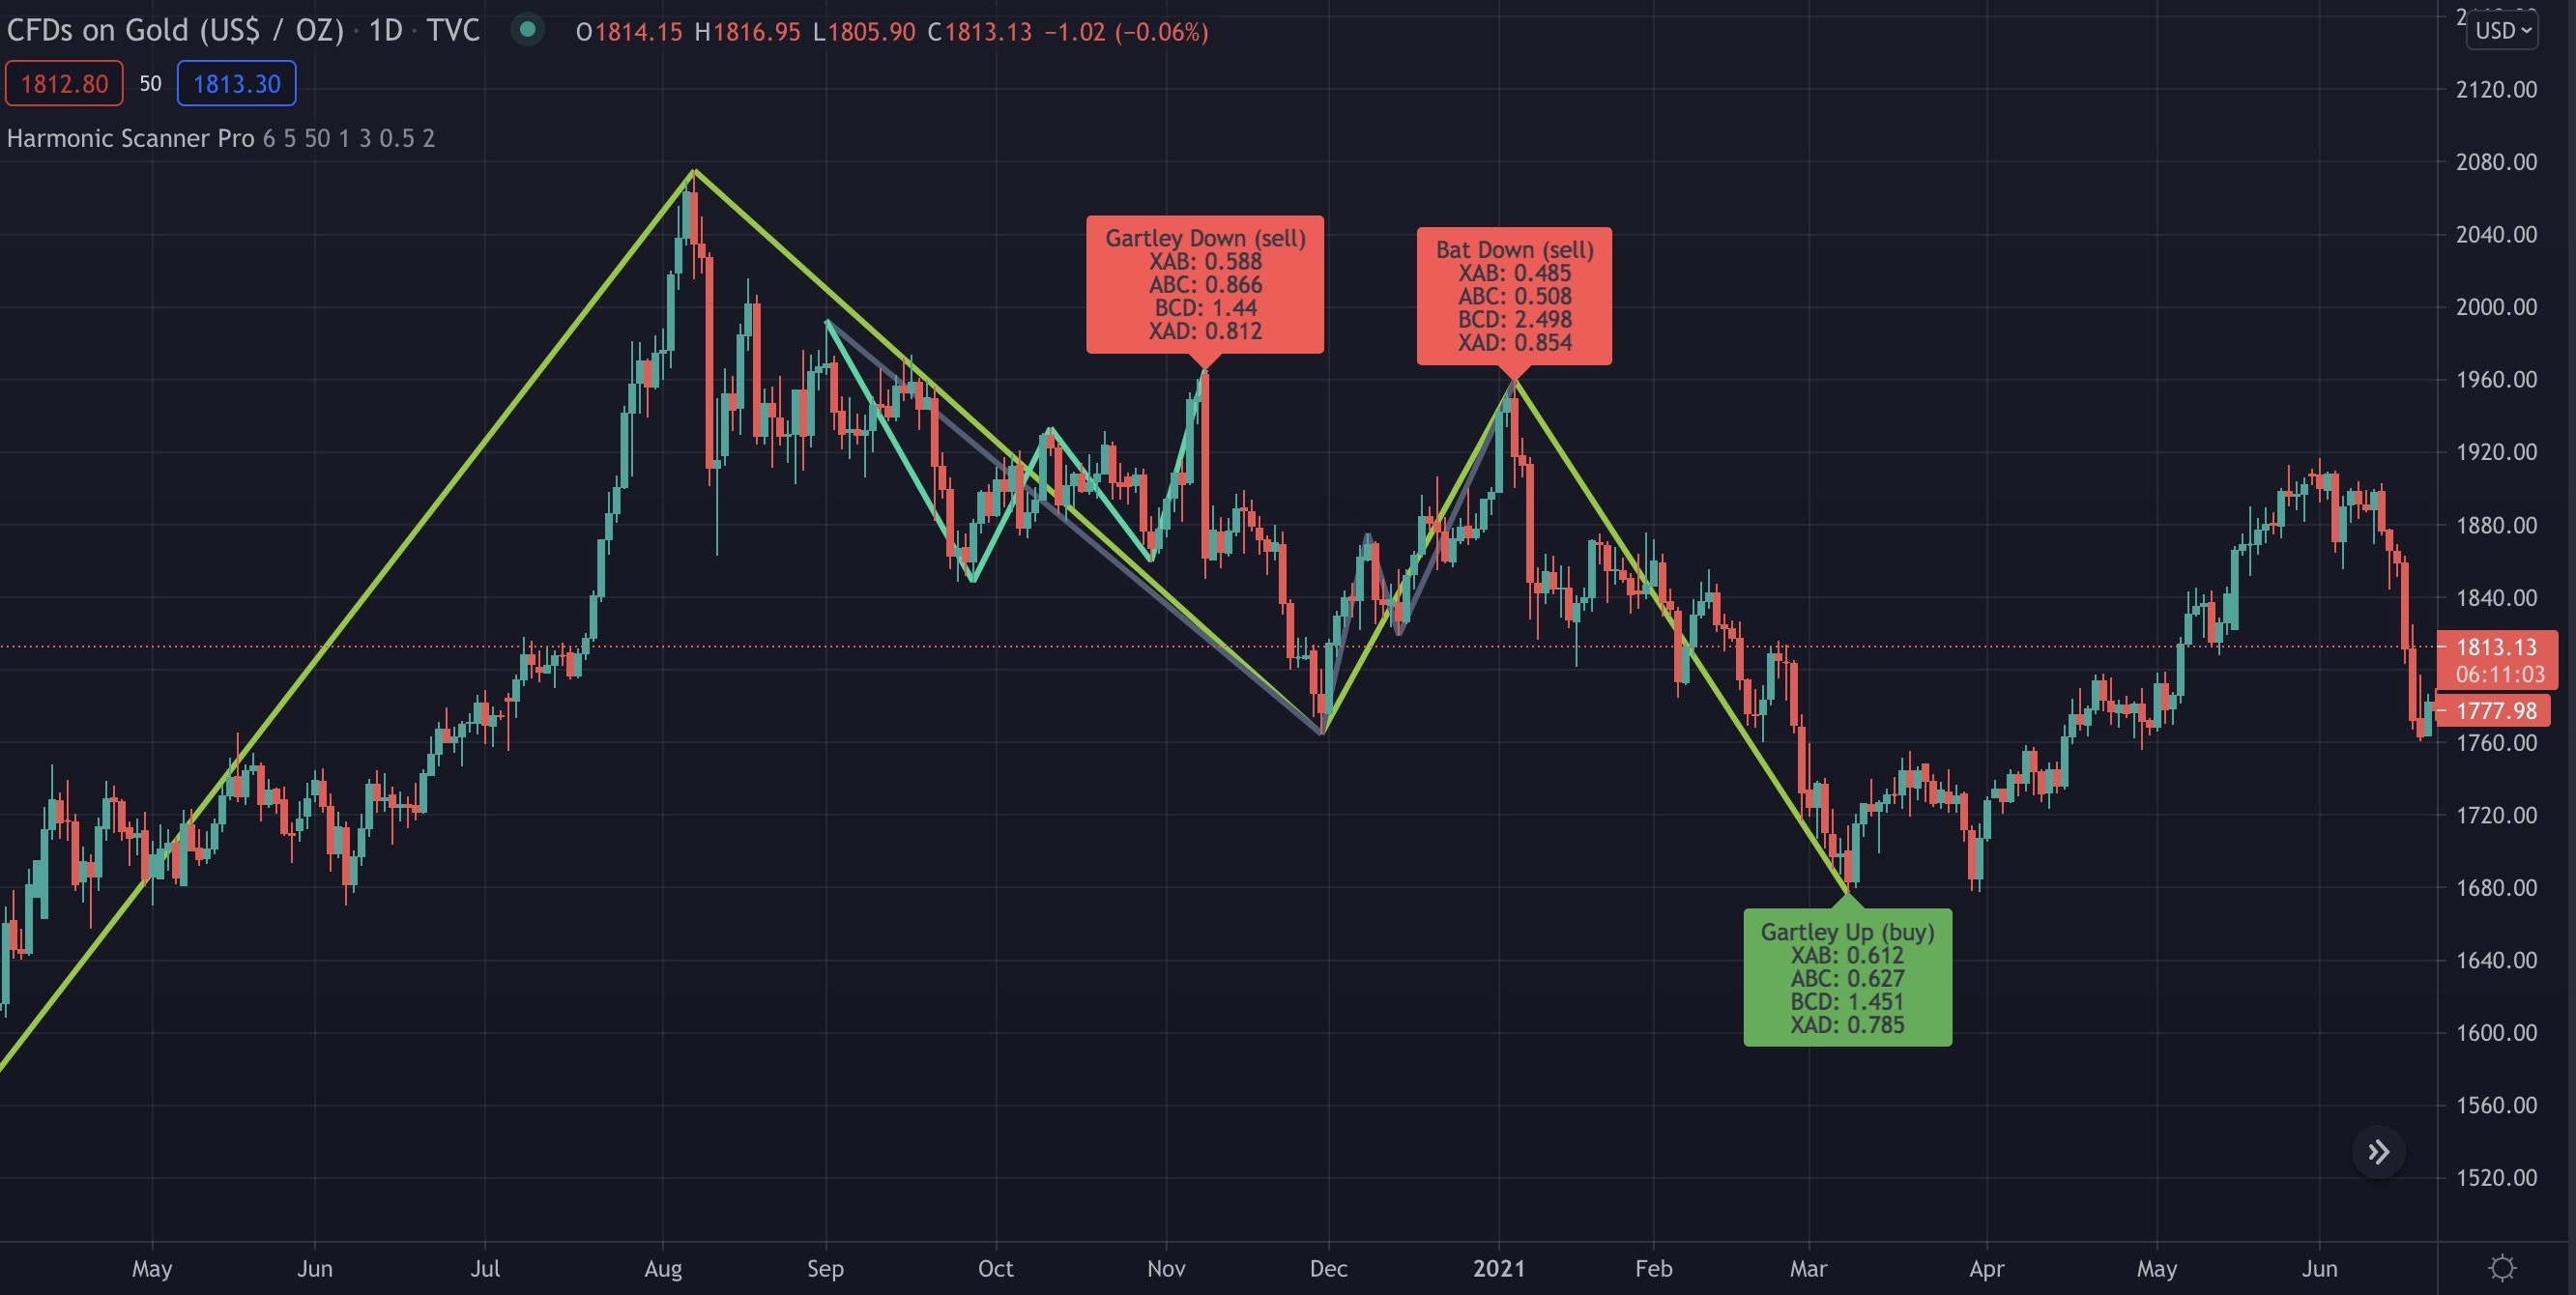
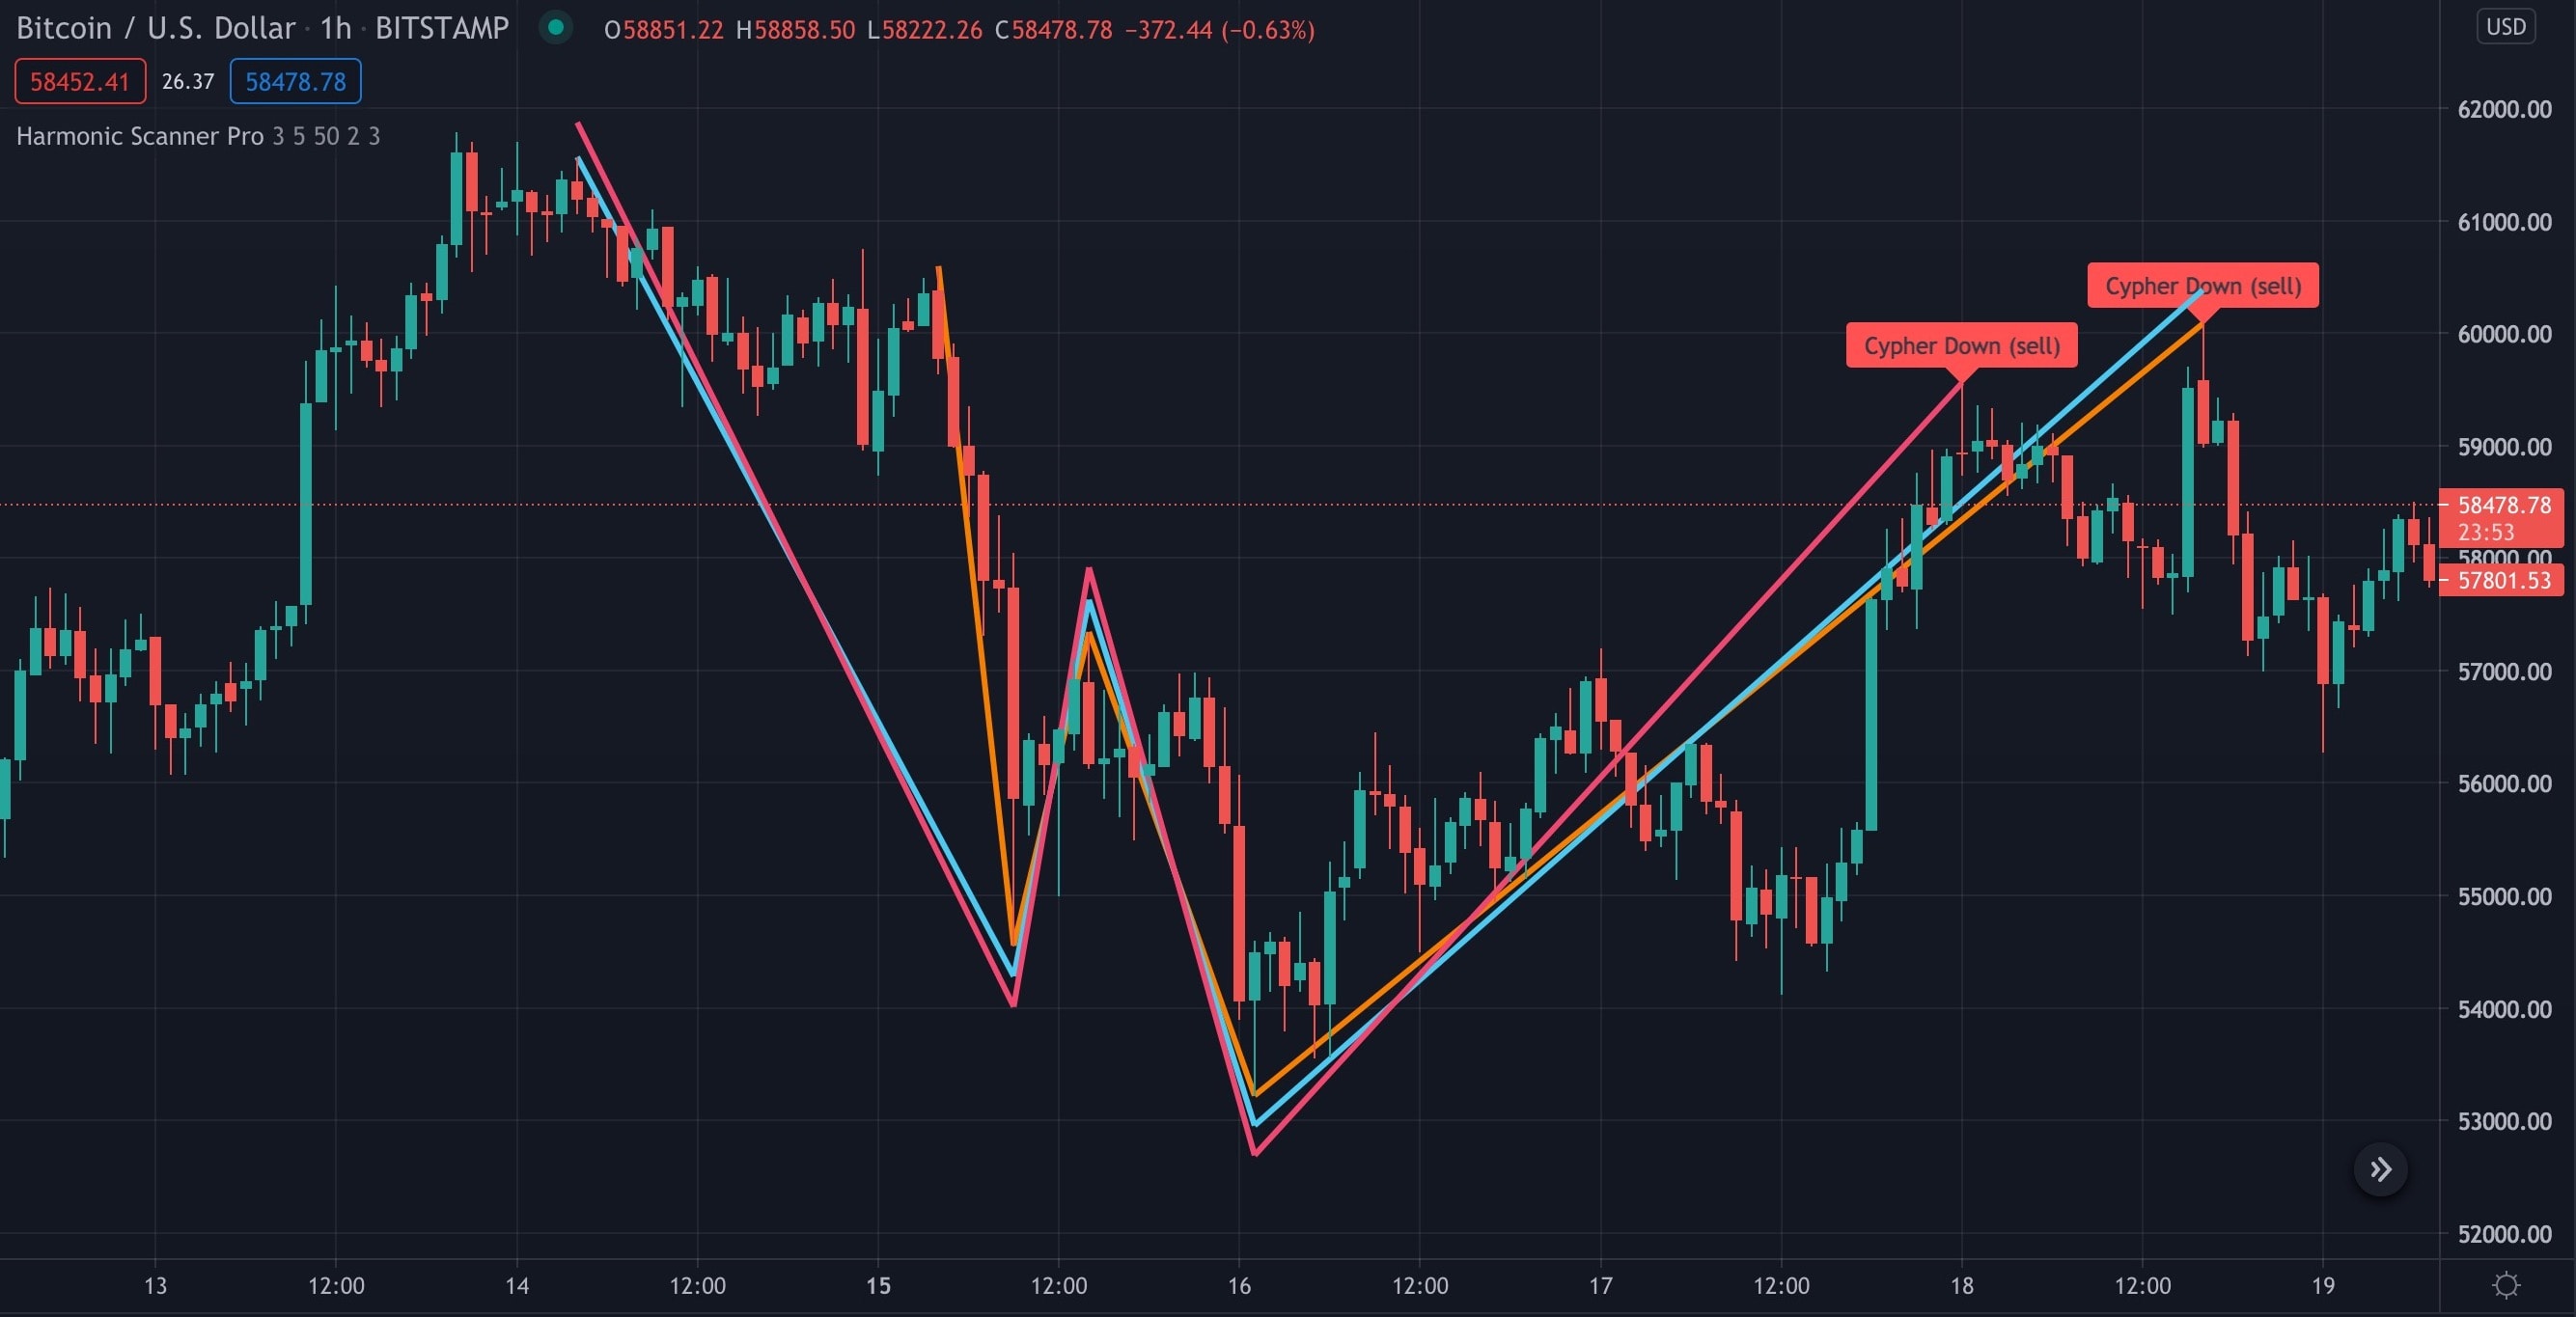
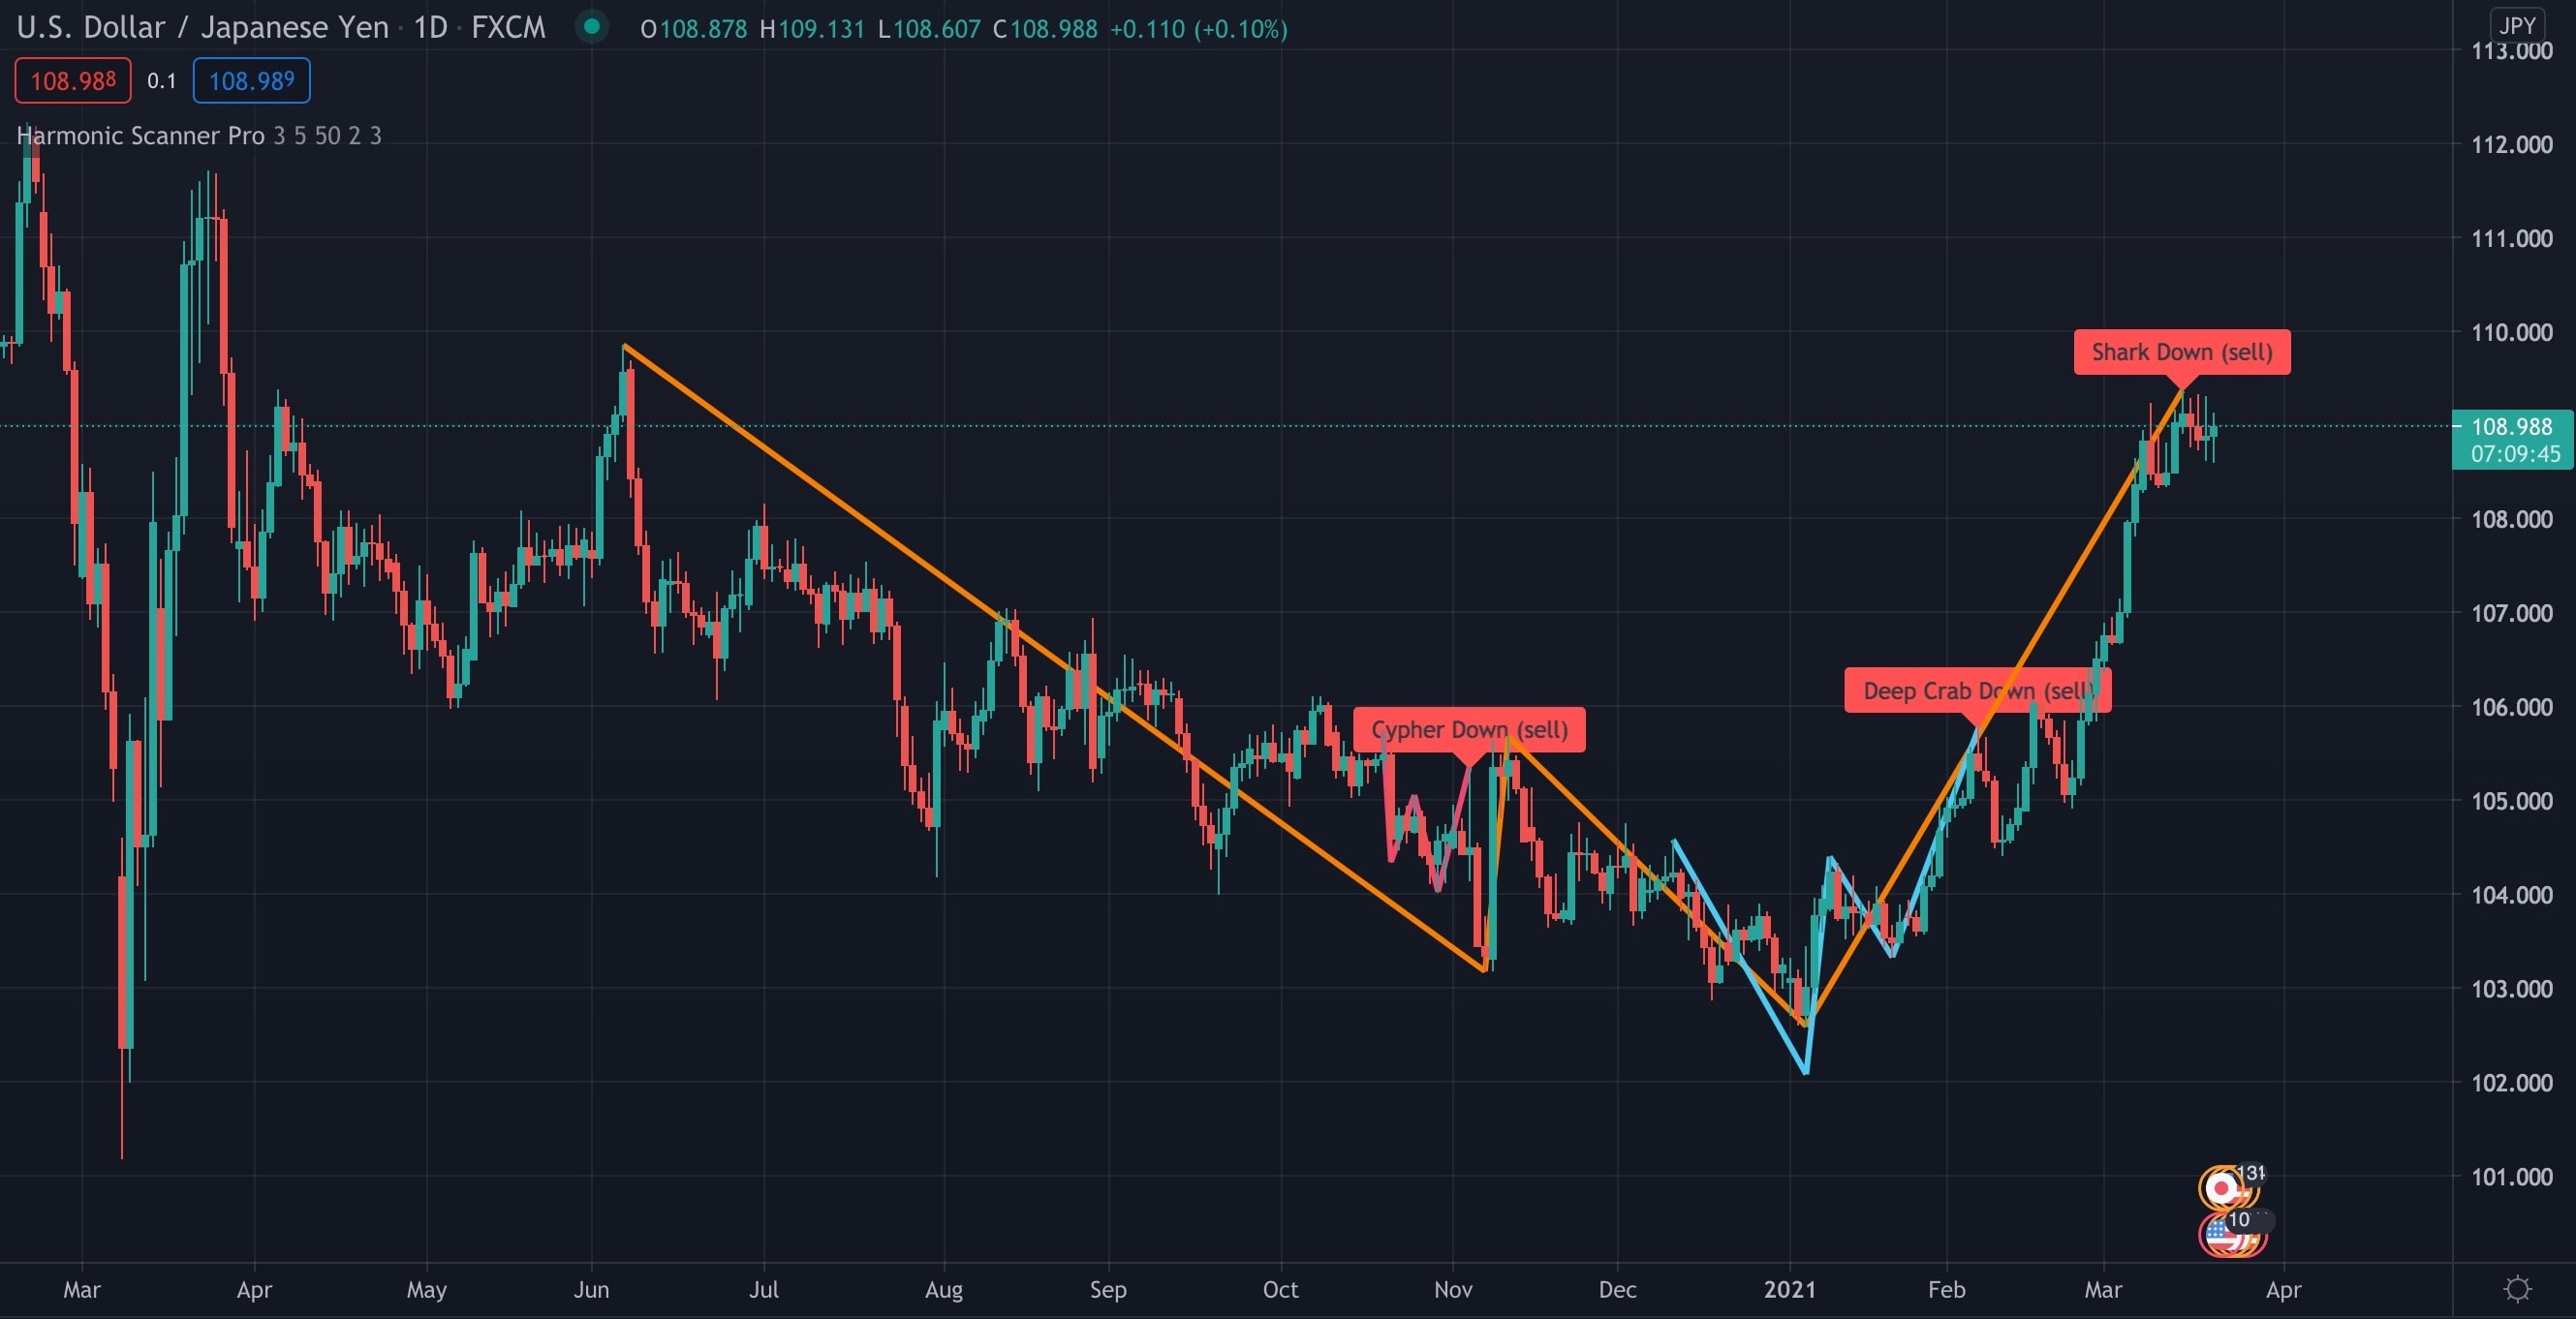
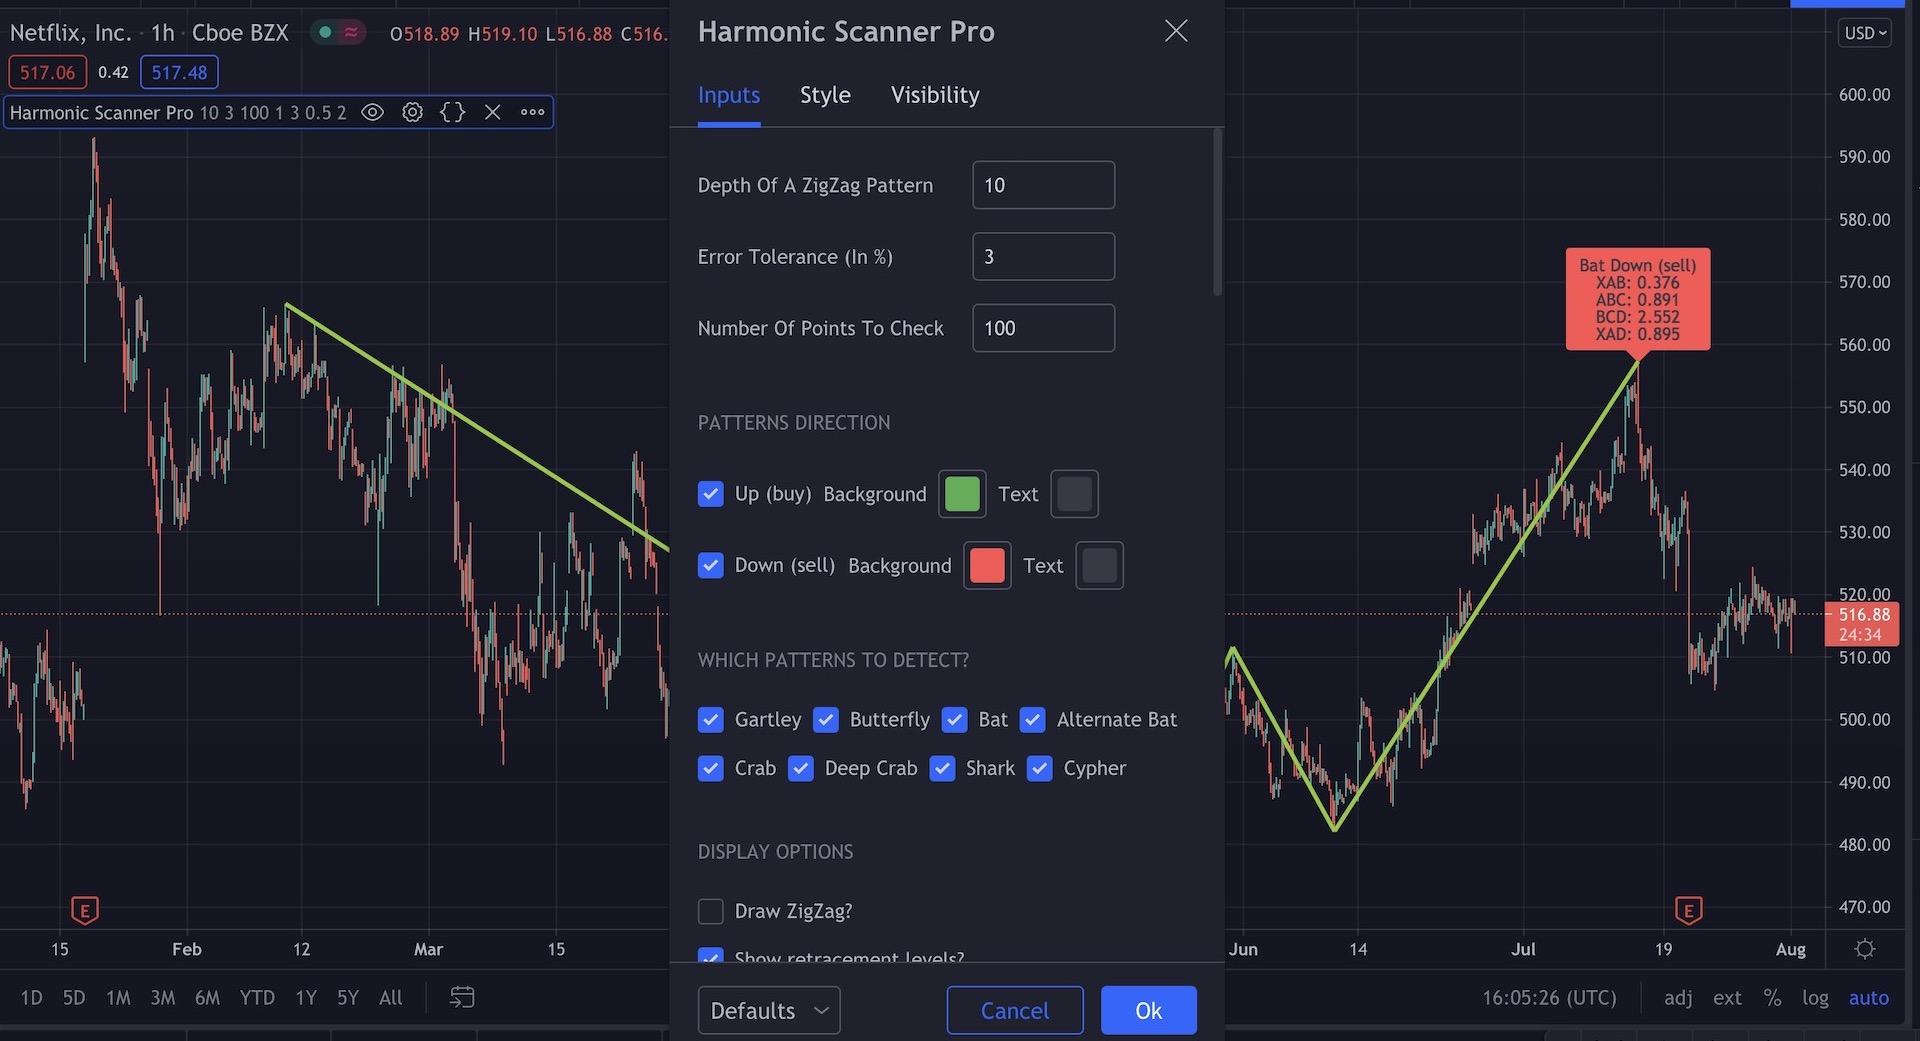
Harmonic Scanner Pro in action
Here are some examples of patterns found by the Harmonic Scanner Pro (click each image to enlarge).
Configuration
Harmonic Scanner Pro comes with the following configuration options
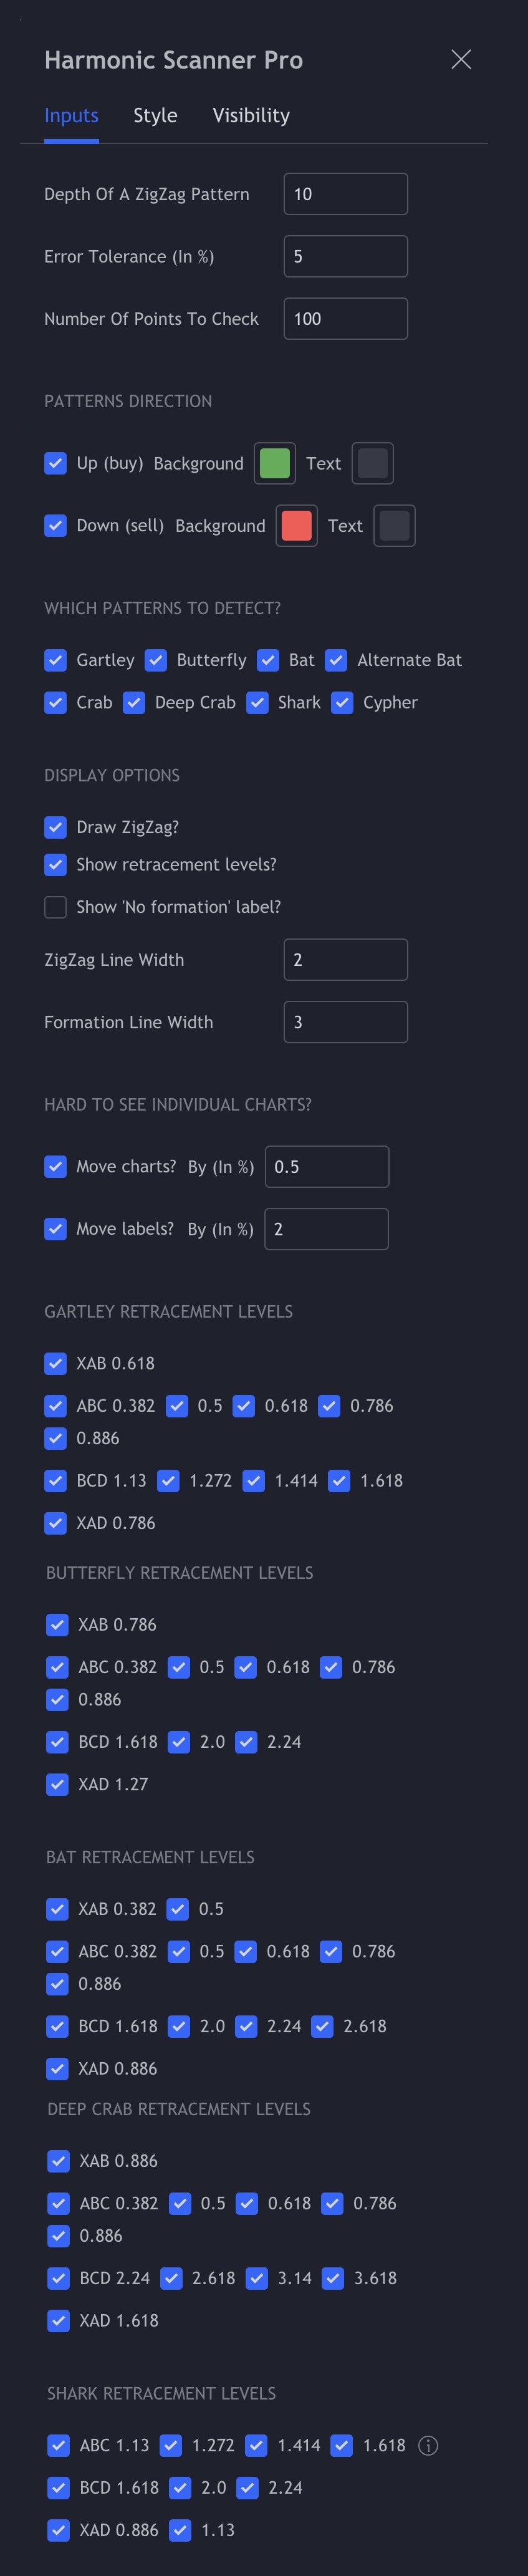
Depth of a ZigZag Pattern
Select how many previous candles to consider when checking for the high/low points (the zigzag). If you choose a high number, there will be fewer points to check, and the script will be faster. If you choose a low number, the script will be slower, but it will check more points. To see which high/low points are checked, enable the "Draw ZigZag" option.
Error Tolerance (In %)
How much the detected pattern can differ from the "ideal" pattern. With a 5% error tolerance, if the "ideal" retracement is equal to 0.618, we accept a retracement between 0.5871 and 0.6489. Not sure what a retracement is? Check out the "What Are Harmonic Patterns?" article.
Number of Points to Check
Select how many past high/low points you want to check for point C. The higher number you choose, the slower this script will work. If you choose a number too big, you might get an error (TradingView scripts have to finish within a specific time). If that happens, lower the number of points to check or increase the "Depth of a ZigZag Pattern."
Patterns Direction (Up/Down)
Choose whether you only want to see "buy" or "sell" signals (or both). You can also adjust the label (background) and text color in case the default colors are hard to read.
Which Patterns To Detect?
If you are only interested in seeing specific harmonic patterns, you can disable the others.
Draw ZigZag?
When enabled, it displays the zigzag pattern (a line that connects the high and low points). Those are the points that we check to find the harmonic patterns. This option is useful for calibrating the zigzag's depth or seeing what points were checked.
Show retracement levels?
When enabled, it shows the retracement values for each pattern leg (XAB, ABC, etc.) in the label under the pattern name. Retracement values can also be displayed when you hover your mouse cursor over the label with the pattern name (no matter if the "Show retracement levels?" option is enabled or disable). This is useful when labels are hard to read because they are on top of each other.
Show 'No formation' label?
Whether or not you want to display the 'No formation" labels.
ZigZag/Formation Line Width
Width of the lines on the chart - it's a purely cosmetic option.
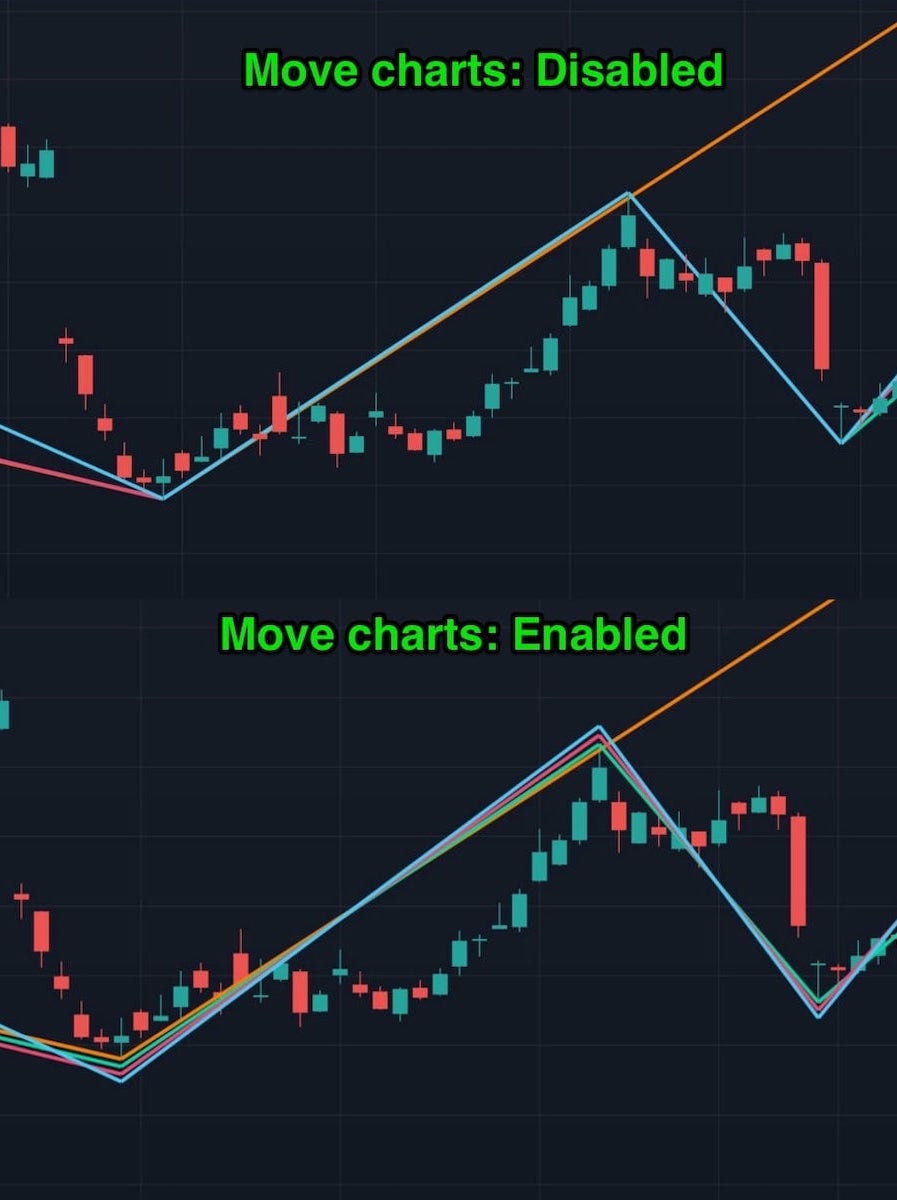
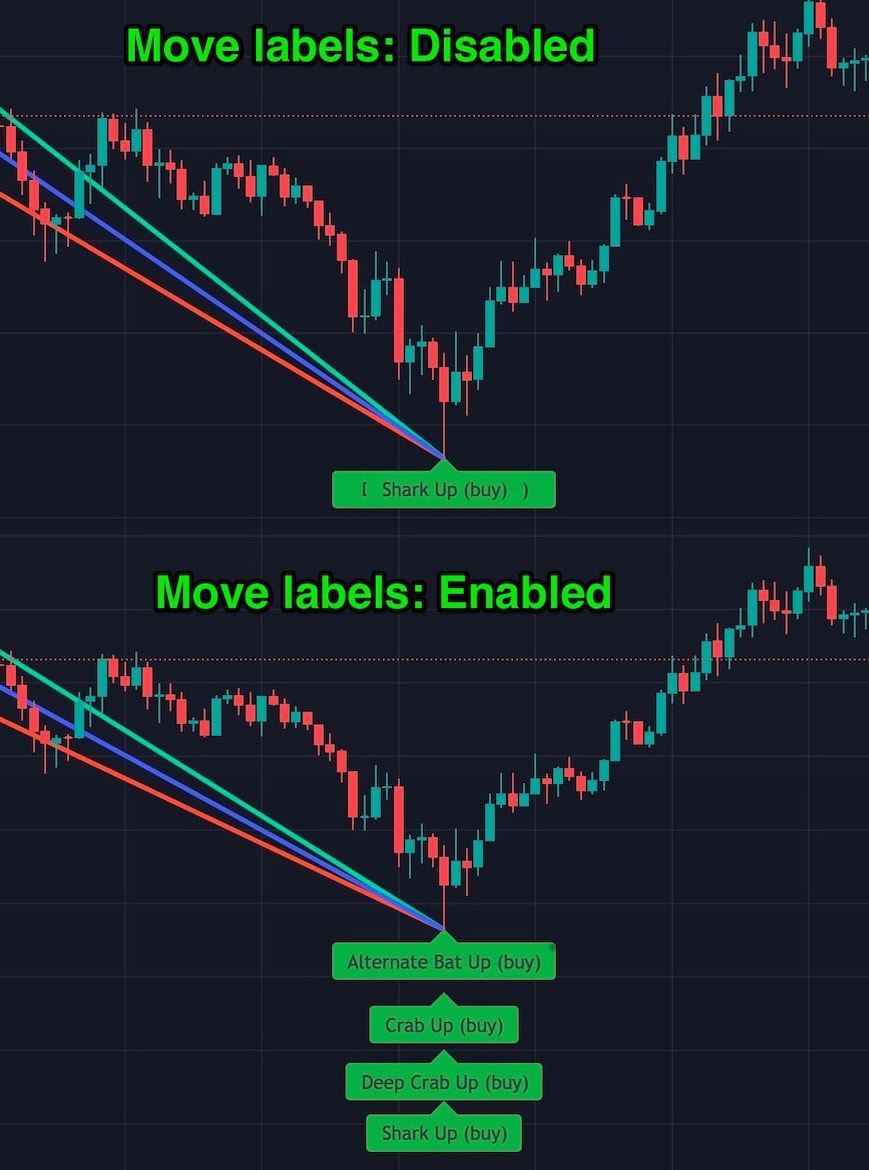
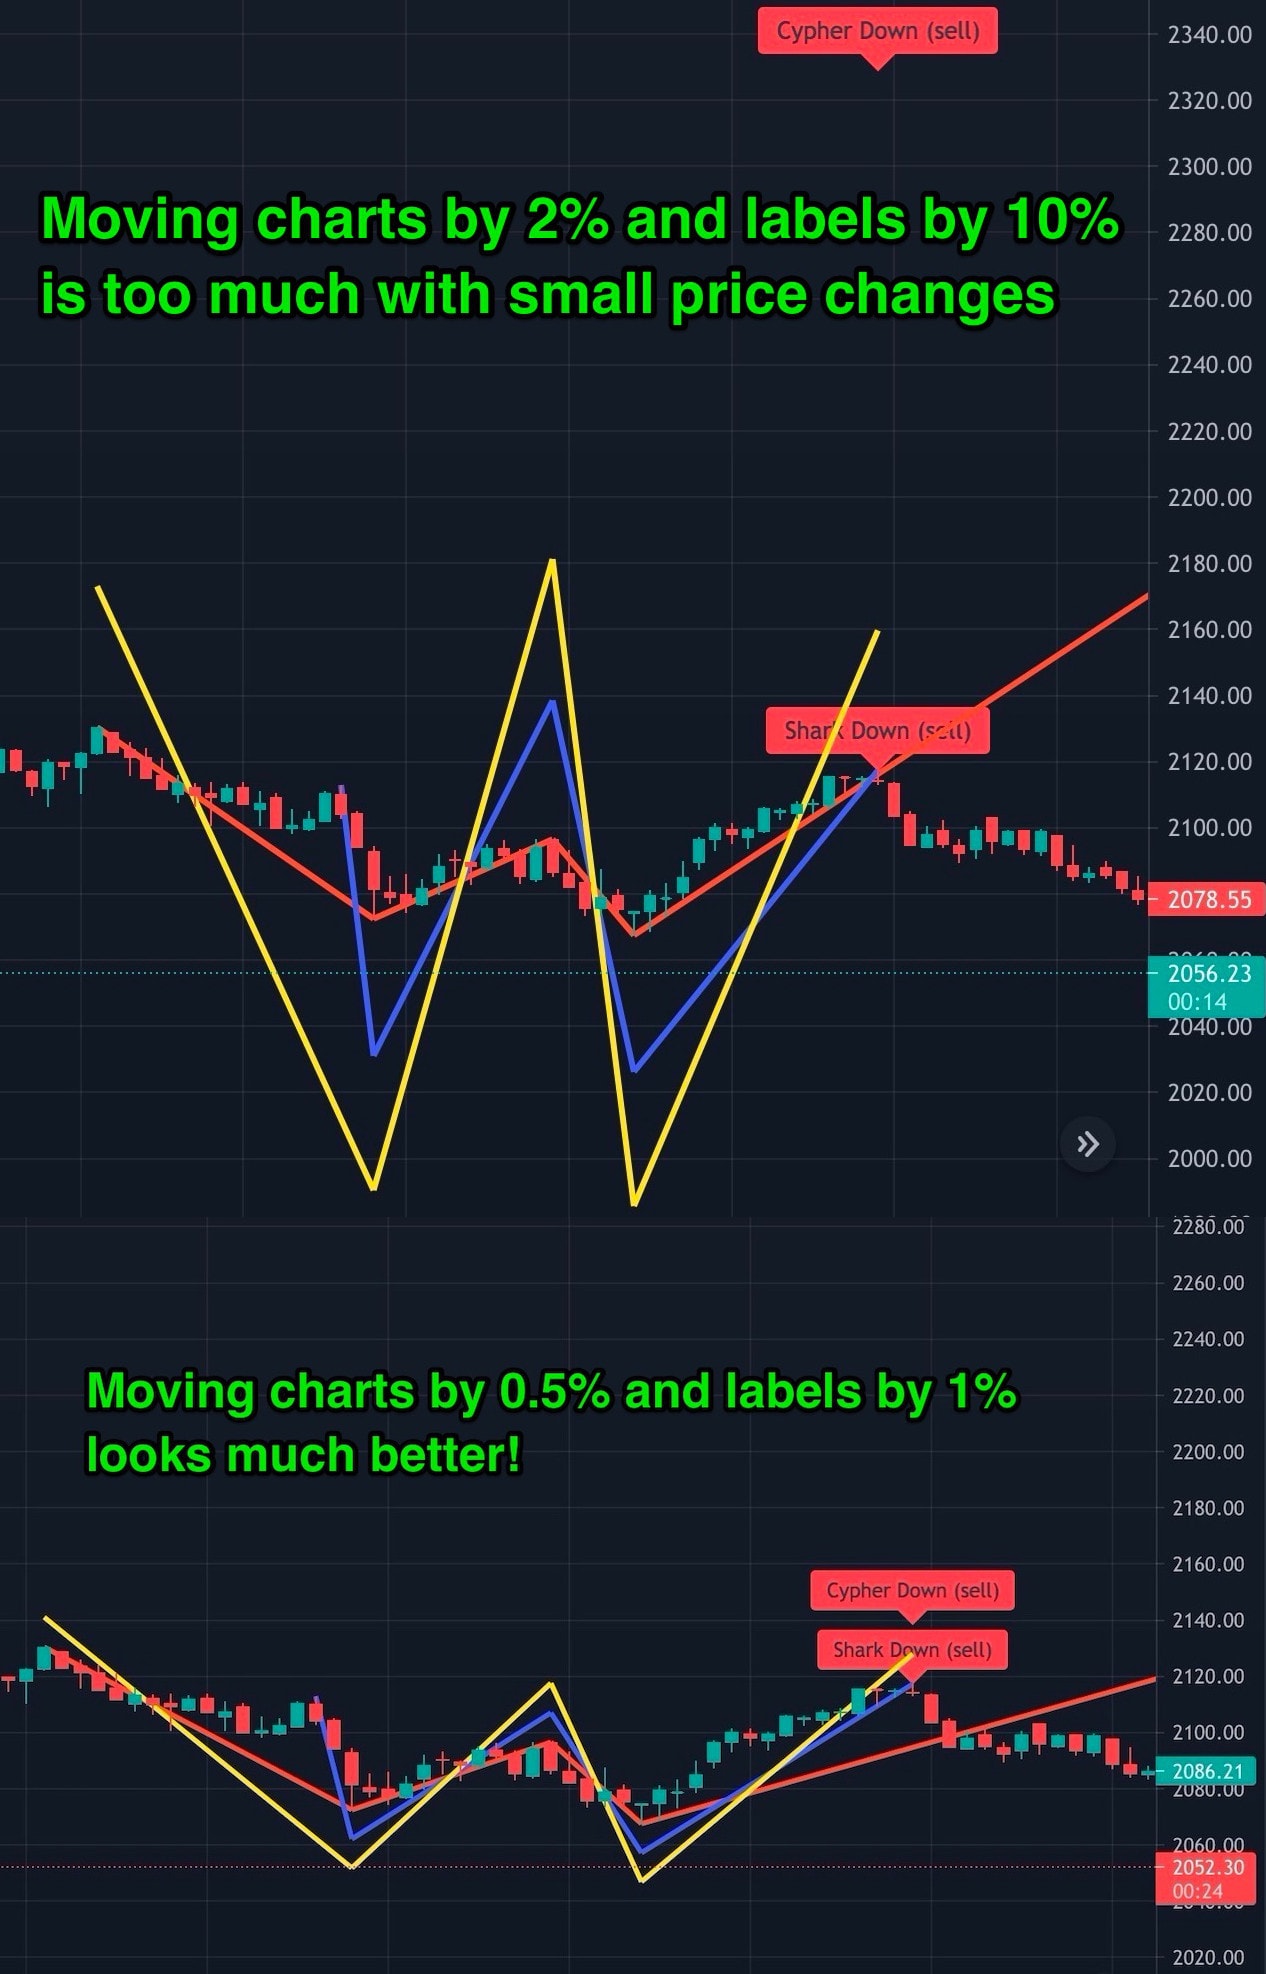
"Move Charts?" and "Move Labels?"
If different patterns share the same points (and often they will), you will only see one of the lines (the topmost one). The same applies to labels - if multiple labels appear on top of each other, you can only see one of them. This makes it harder to see how each pattern looks like, especially when there are many patterns. Enable "Move Charts" to move each line a bit and "Move Labels" to move the labels. That way, you will see all the lines and labels separately.
You can also select how much you want to move each line or label (in a percentage of the current price value). For an hourly, daily, or weekly time interval, the default value of 2% for line and 10% for label looks fine. But if you use smaller intervals where the price changes are much smaller, the default values will move charts a lot, so you might want to lower this setting. See the images below for a graphical explanation.
Gartley/Butterfly/Bat... retracement levels
Here you can disable retracement levels that you don't want to check. For example, maybe you are looking for a "Perfect Bat Pattern" (described in "Harmonic Trading Volume 1" by Scott Carney). To find only the "perfect bats," enable the 0.382 retracement level for XAB, 0.5 and 0.618 for ABC, 2.0 for BCD, and 0.886 for XAD leg (and disable all other retracement levels for Bat pattern).
Those checkboxes let you really configure the script to your exact needs (especially since different books/websites suggest using different retracement levels). Just keep in mind that if you disable all checkboxes for a given retracement (for example, you uncheck "BCD 1.13", "1.272", "1.414", "1.618" for the Gartley pattern), the script will no longer detect that pattern (so at least 1 checkbox has to be enabled!)
For the Shark pattern, we assume that the formation points are named X,A,B,C,D - just like all the other formations, and not 0,X,A,B,C like in some literature.
Frequently Asked Questions
I've added the script to my chart, but nothing has changed. Does it work?
If there is no harmonic pattern, then nothing will be drawn on the chart. Harmonic patterns are rare. They don't appear on every chart all the time. You can display the zigzag pattern to see what points were checked and change the depth of the zigzag to check more or fewer points. See the configuration options above.
How do I cancel my subscription?
All subscriptions are managed through the Gumroad website. When you buy access to the script, you will get an email containing a link to cancel your subscription. You can also just send us an email, and we will cancel it for you.