Why?
Because instead of profiting once (when a harmonic formation appears), it's better to profit twice!
How does it work?
We check the first 4 points of the XABCD formation to see if there is a chance to predict a harmonic pattern. If yes, we estimate at what price level the last point (point D) will appear. And then we draw it with some error margin. For you - as the user - everything is fully automatic.
Keep reading for instructions how to use it, a description of the configuration options, and answers to the frequently asked questions.
What does it mean to you?
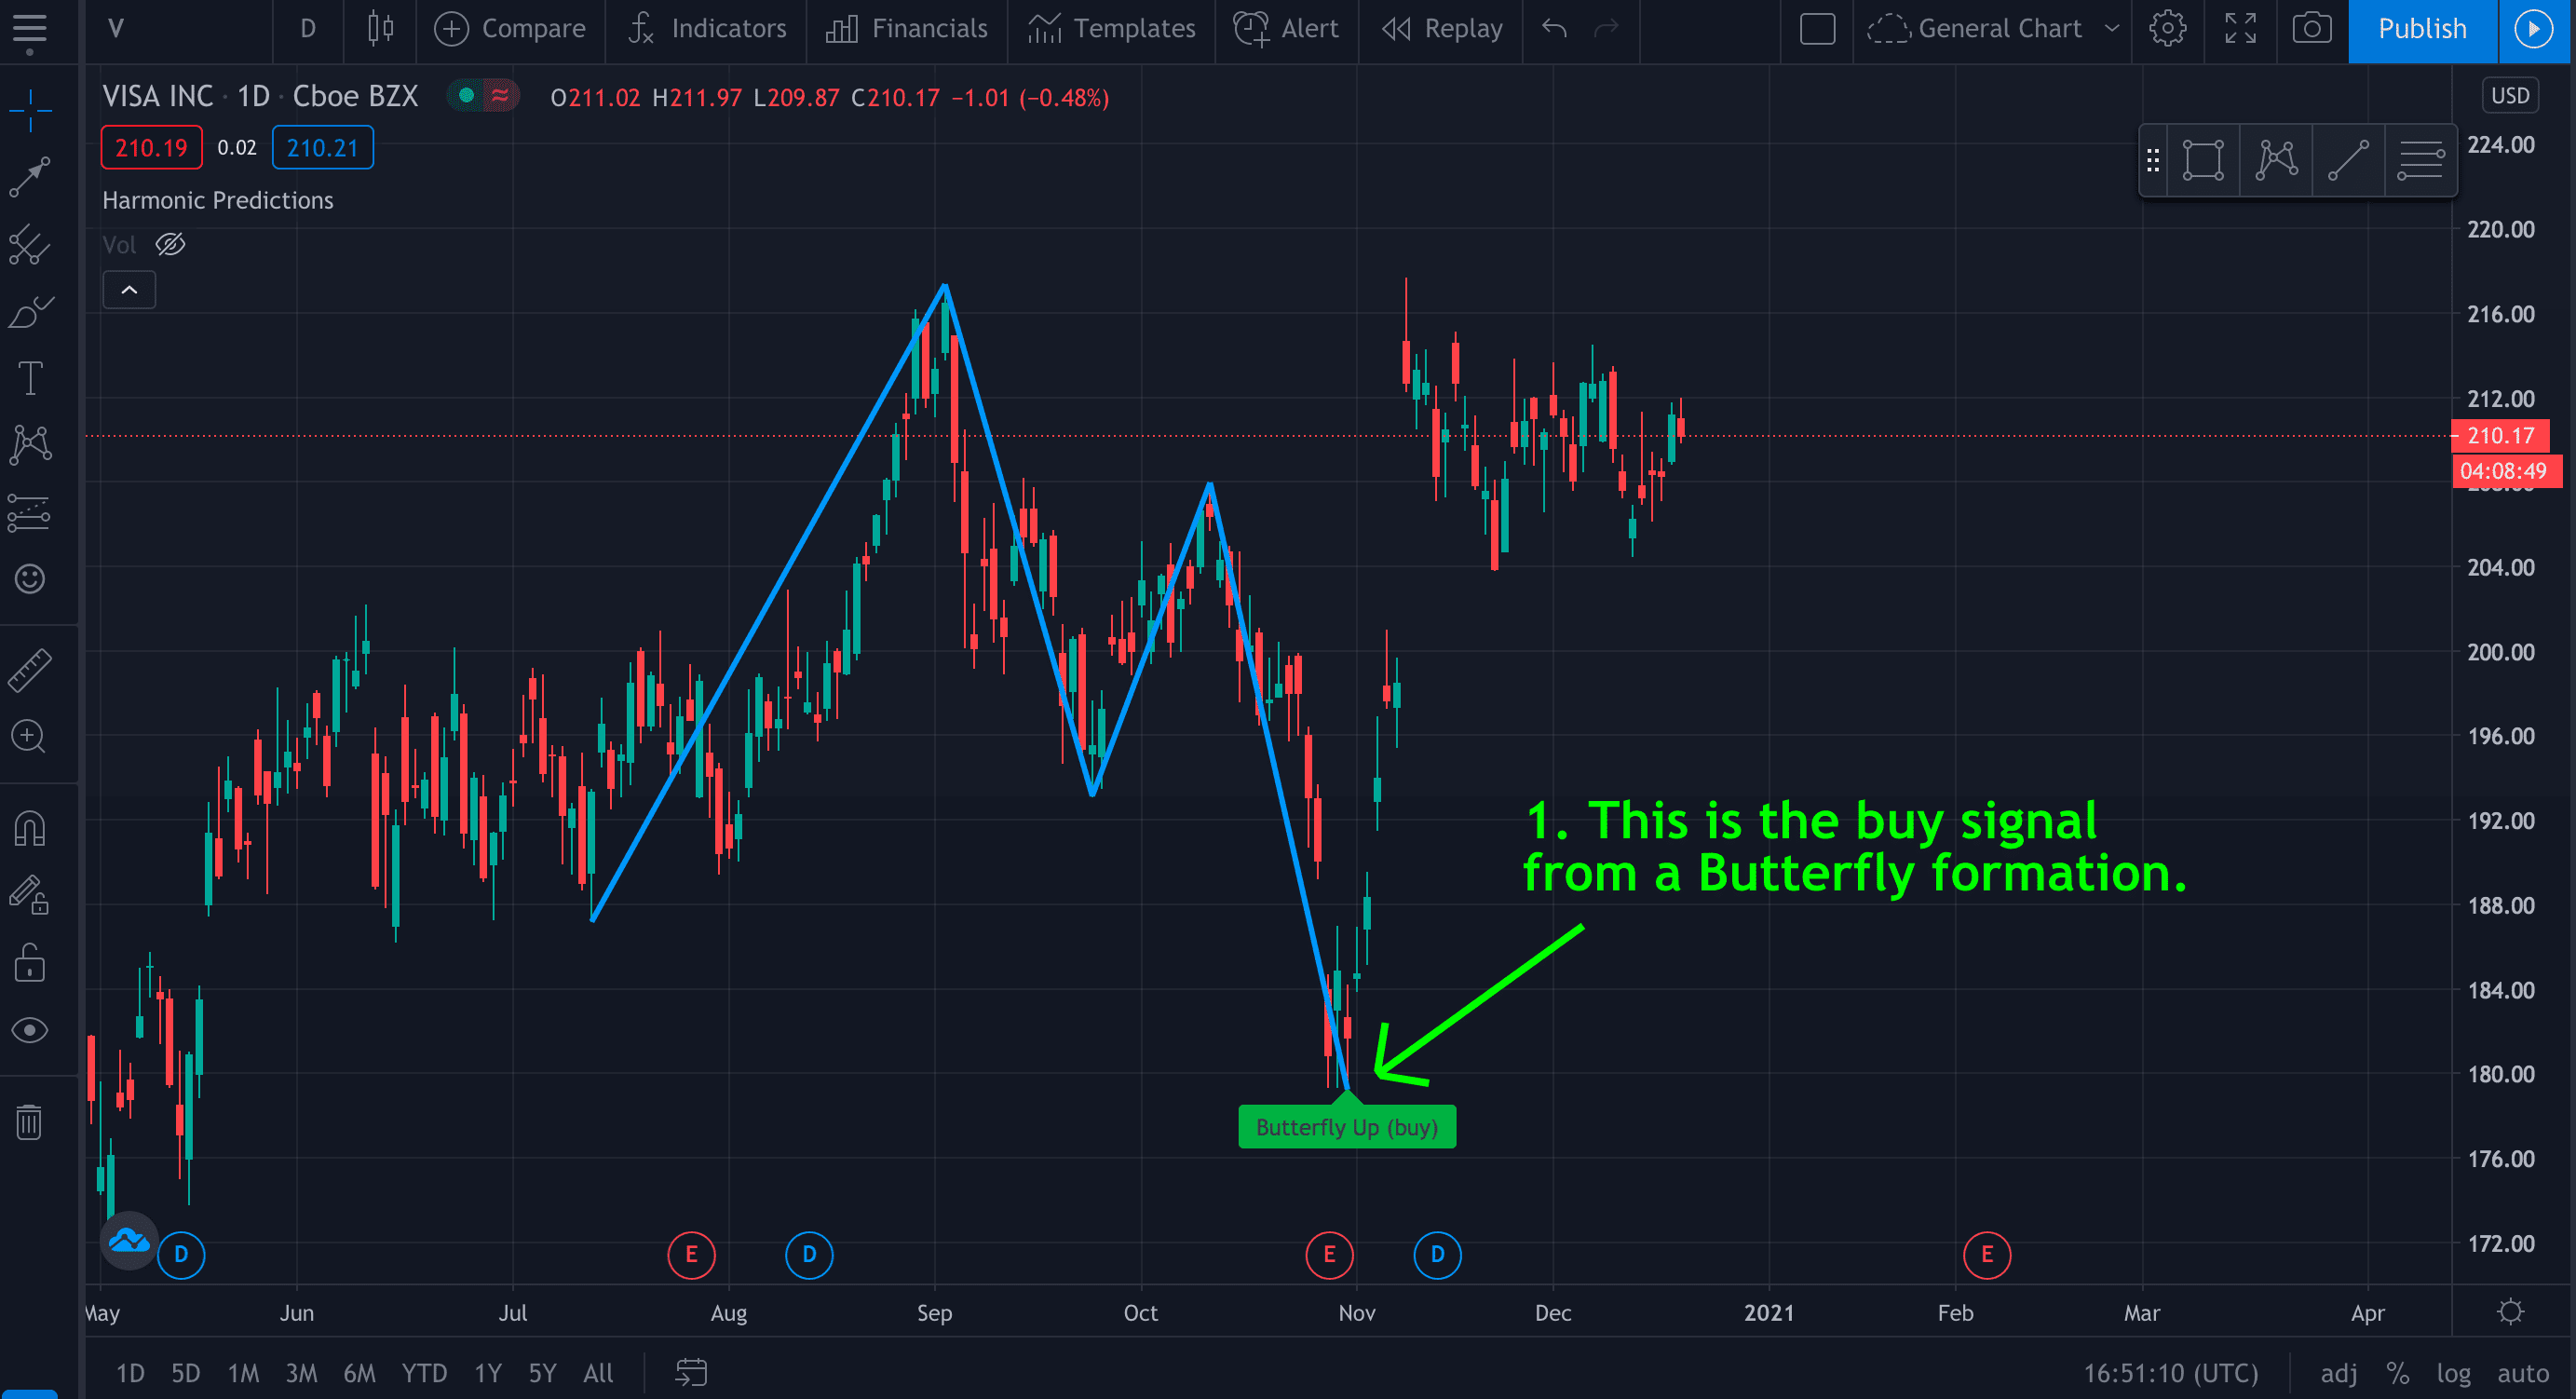
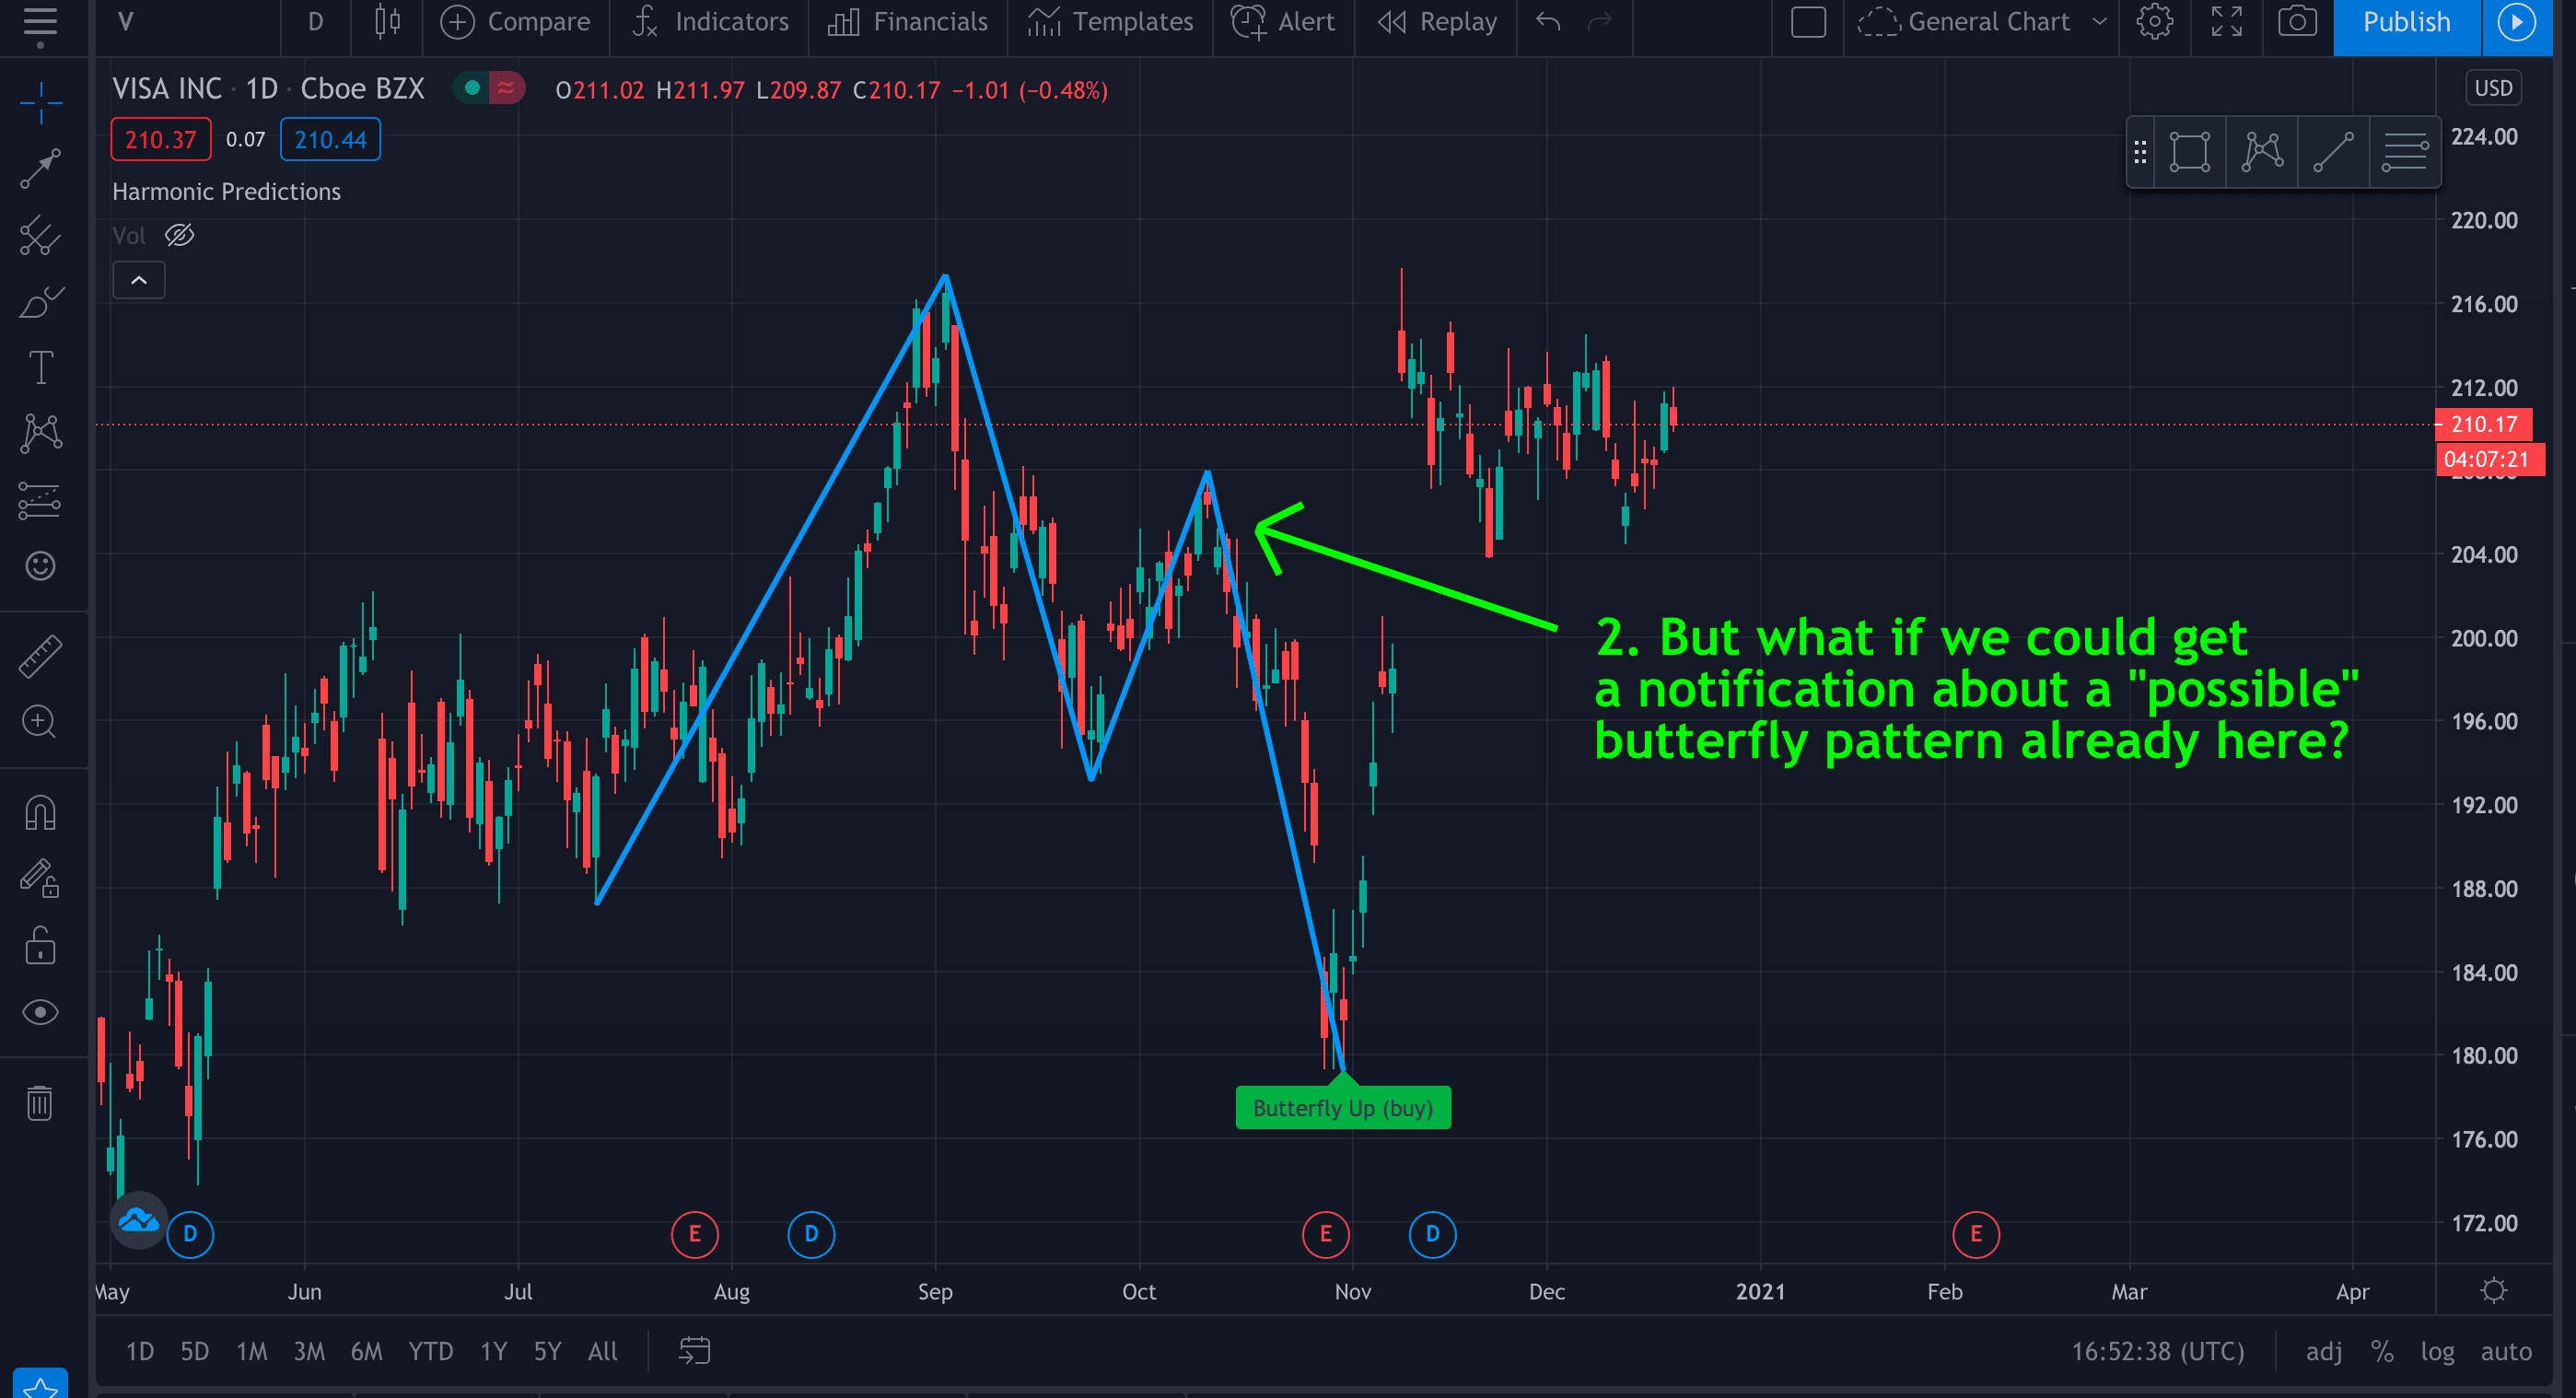
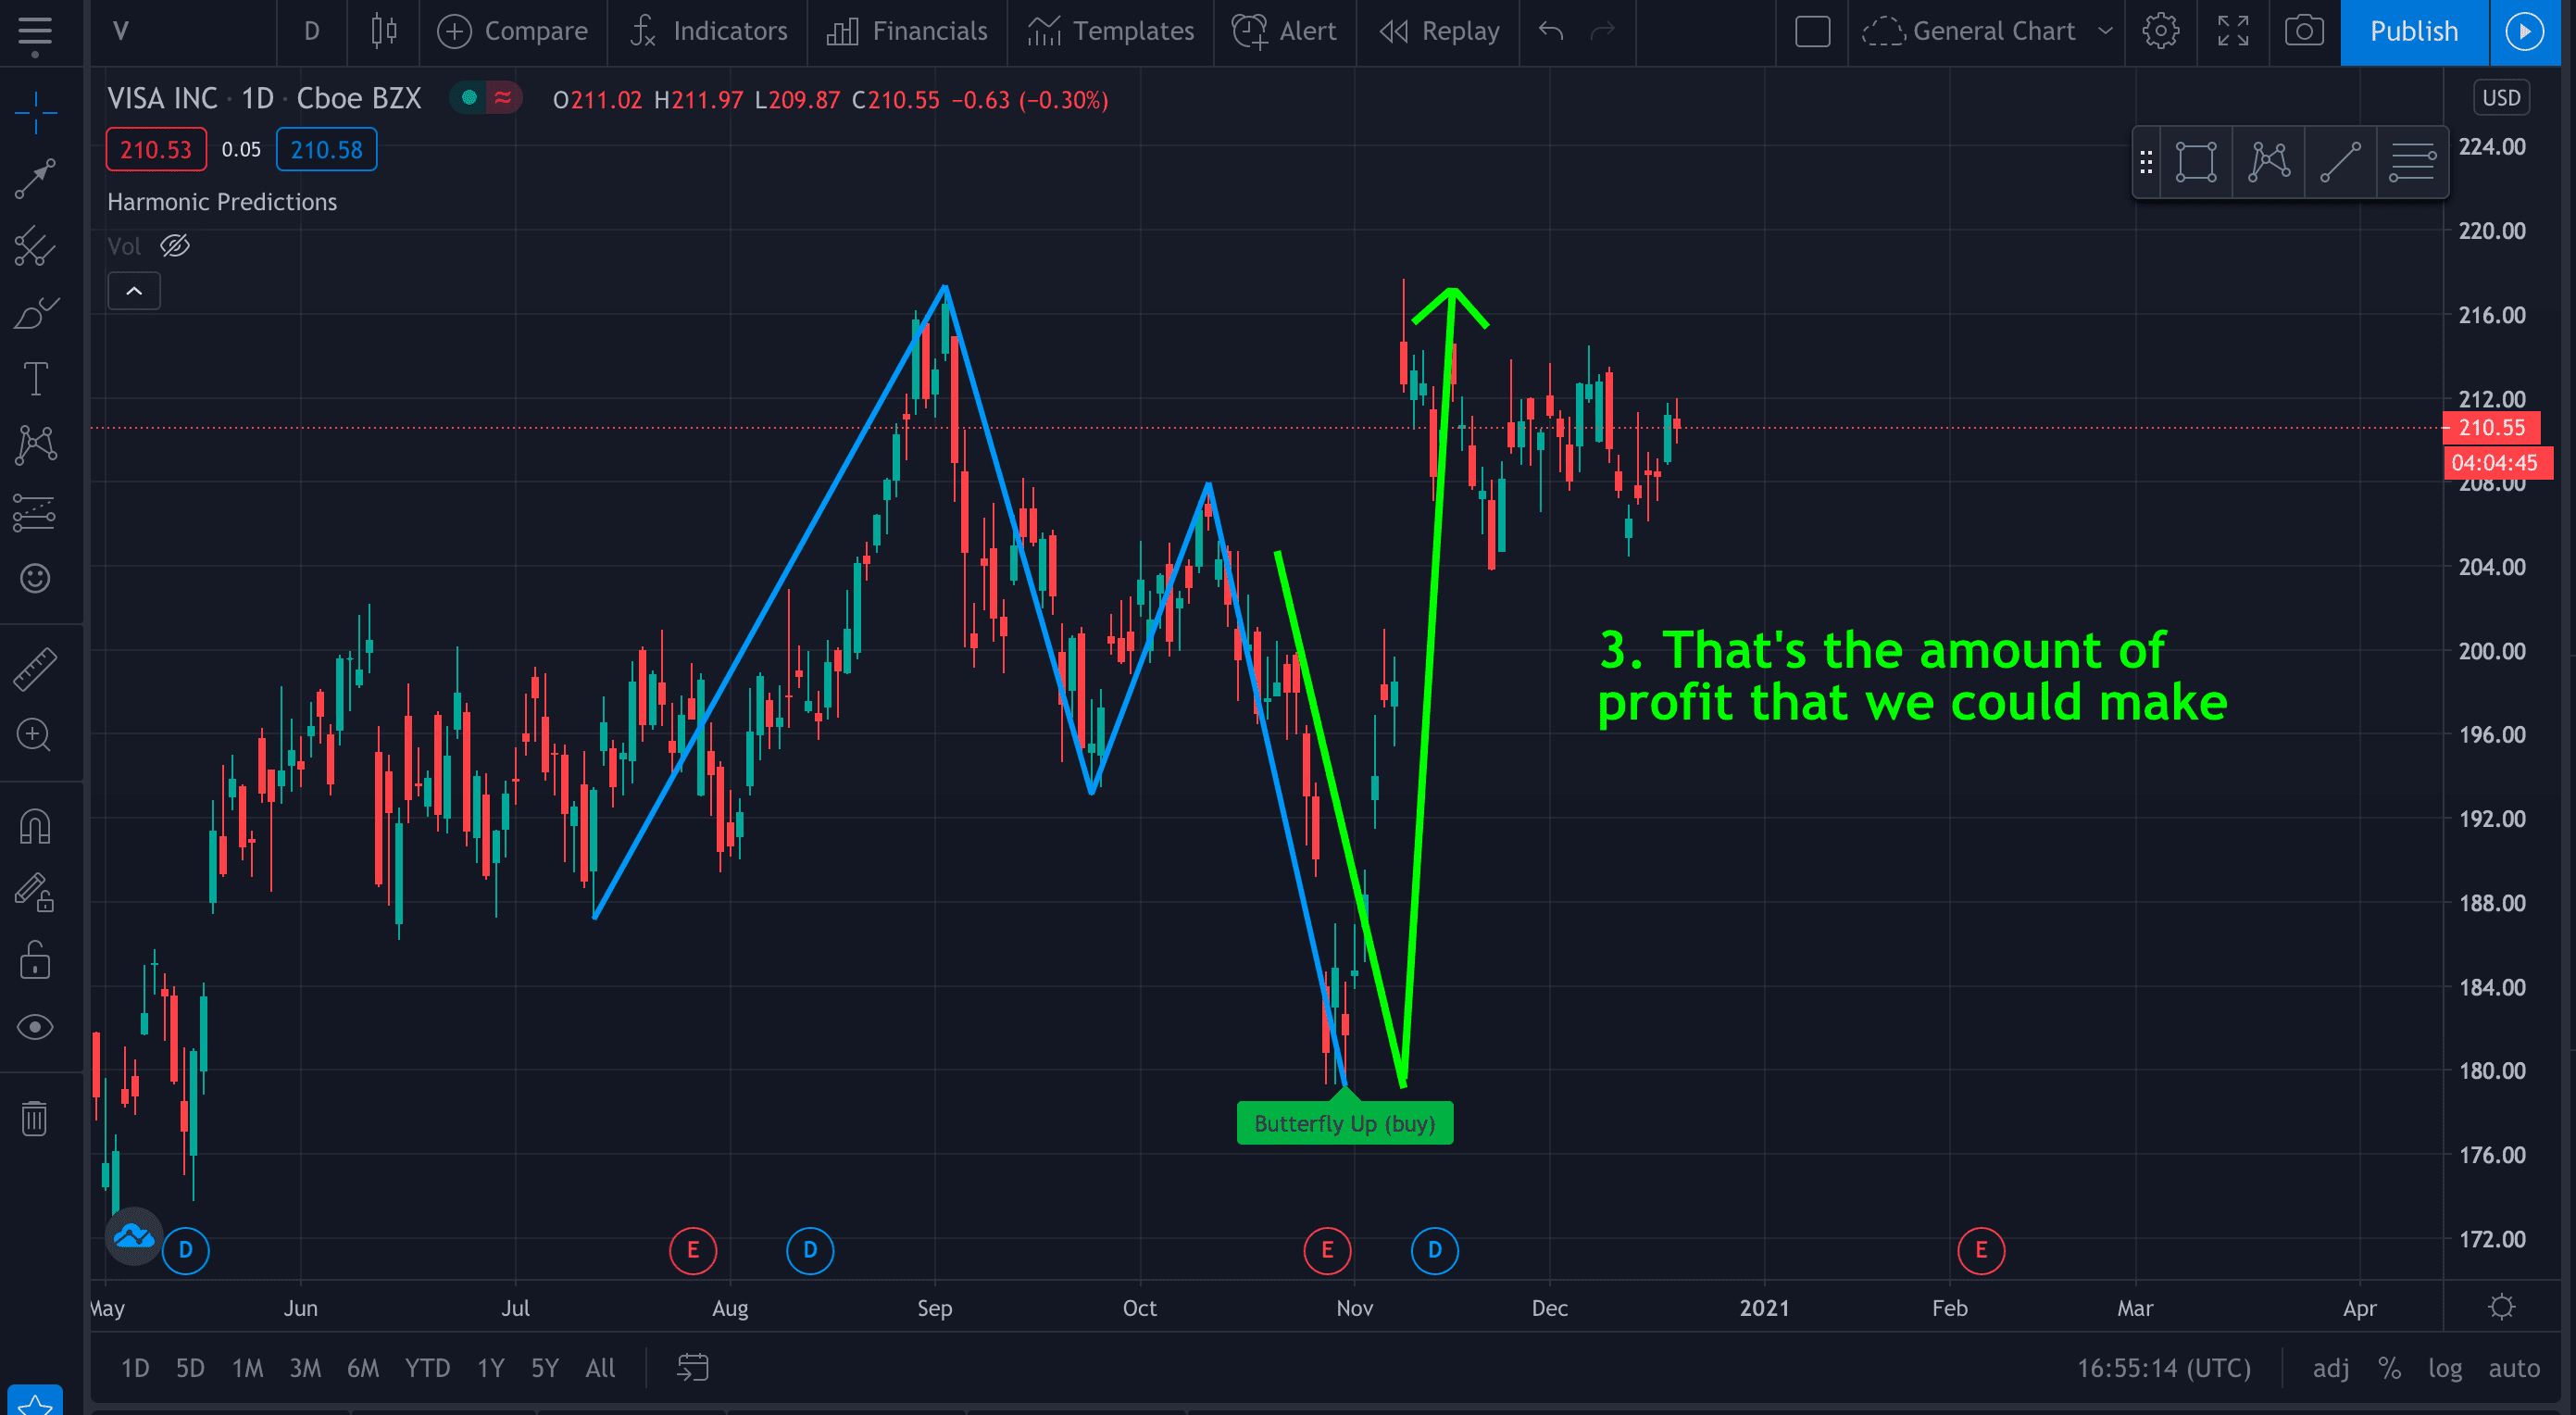
By predicting the possible price level where a harmonic formation will form, you can profit twice. Once, on the way from point C to D. Then, you reverse your position in point D (you close a short position and open a long one) to profit again.
While more profitable, this method is riskier than only relying on fully-formed harmonic patterns. Not every "possible formation" will end up being a "real formation."
How can I buy it?
We no longer accept new users. If you already have a subscription, you can continue using it.
How to use it?
Here is a short video explaining how to add this indicator to your charts, configure it, set up alerts and more:
Don't like videos?
Here is a step-by-step instruction
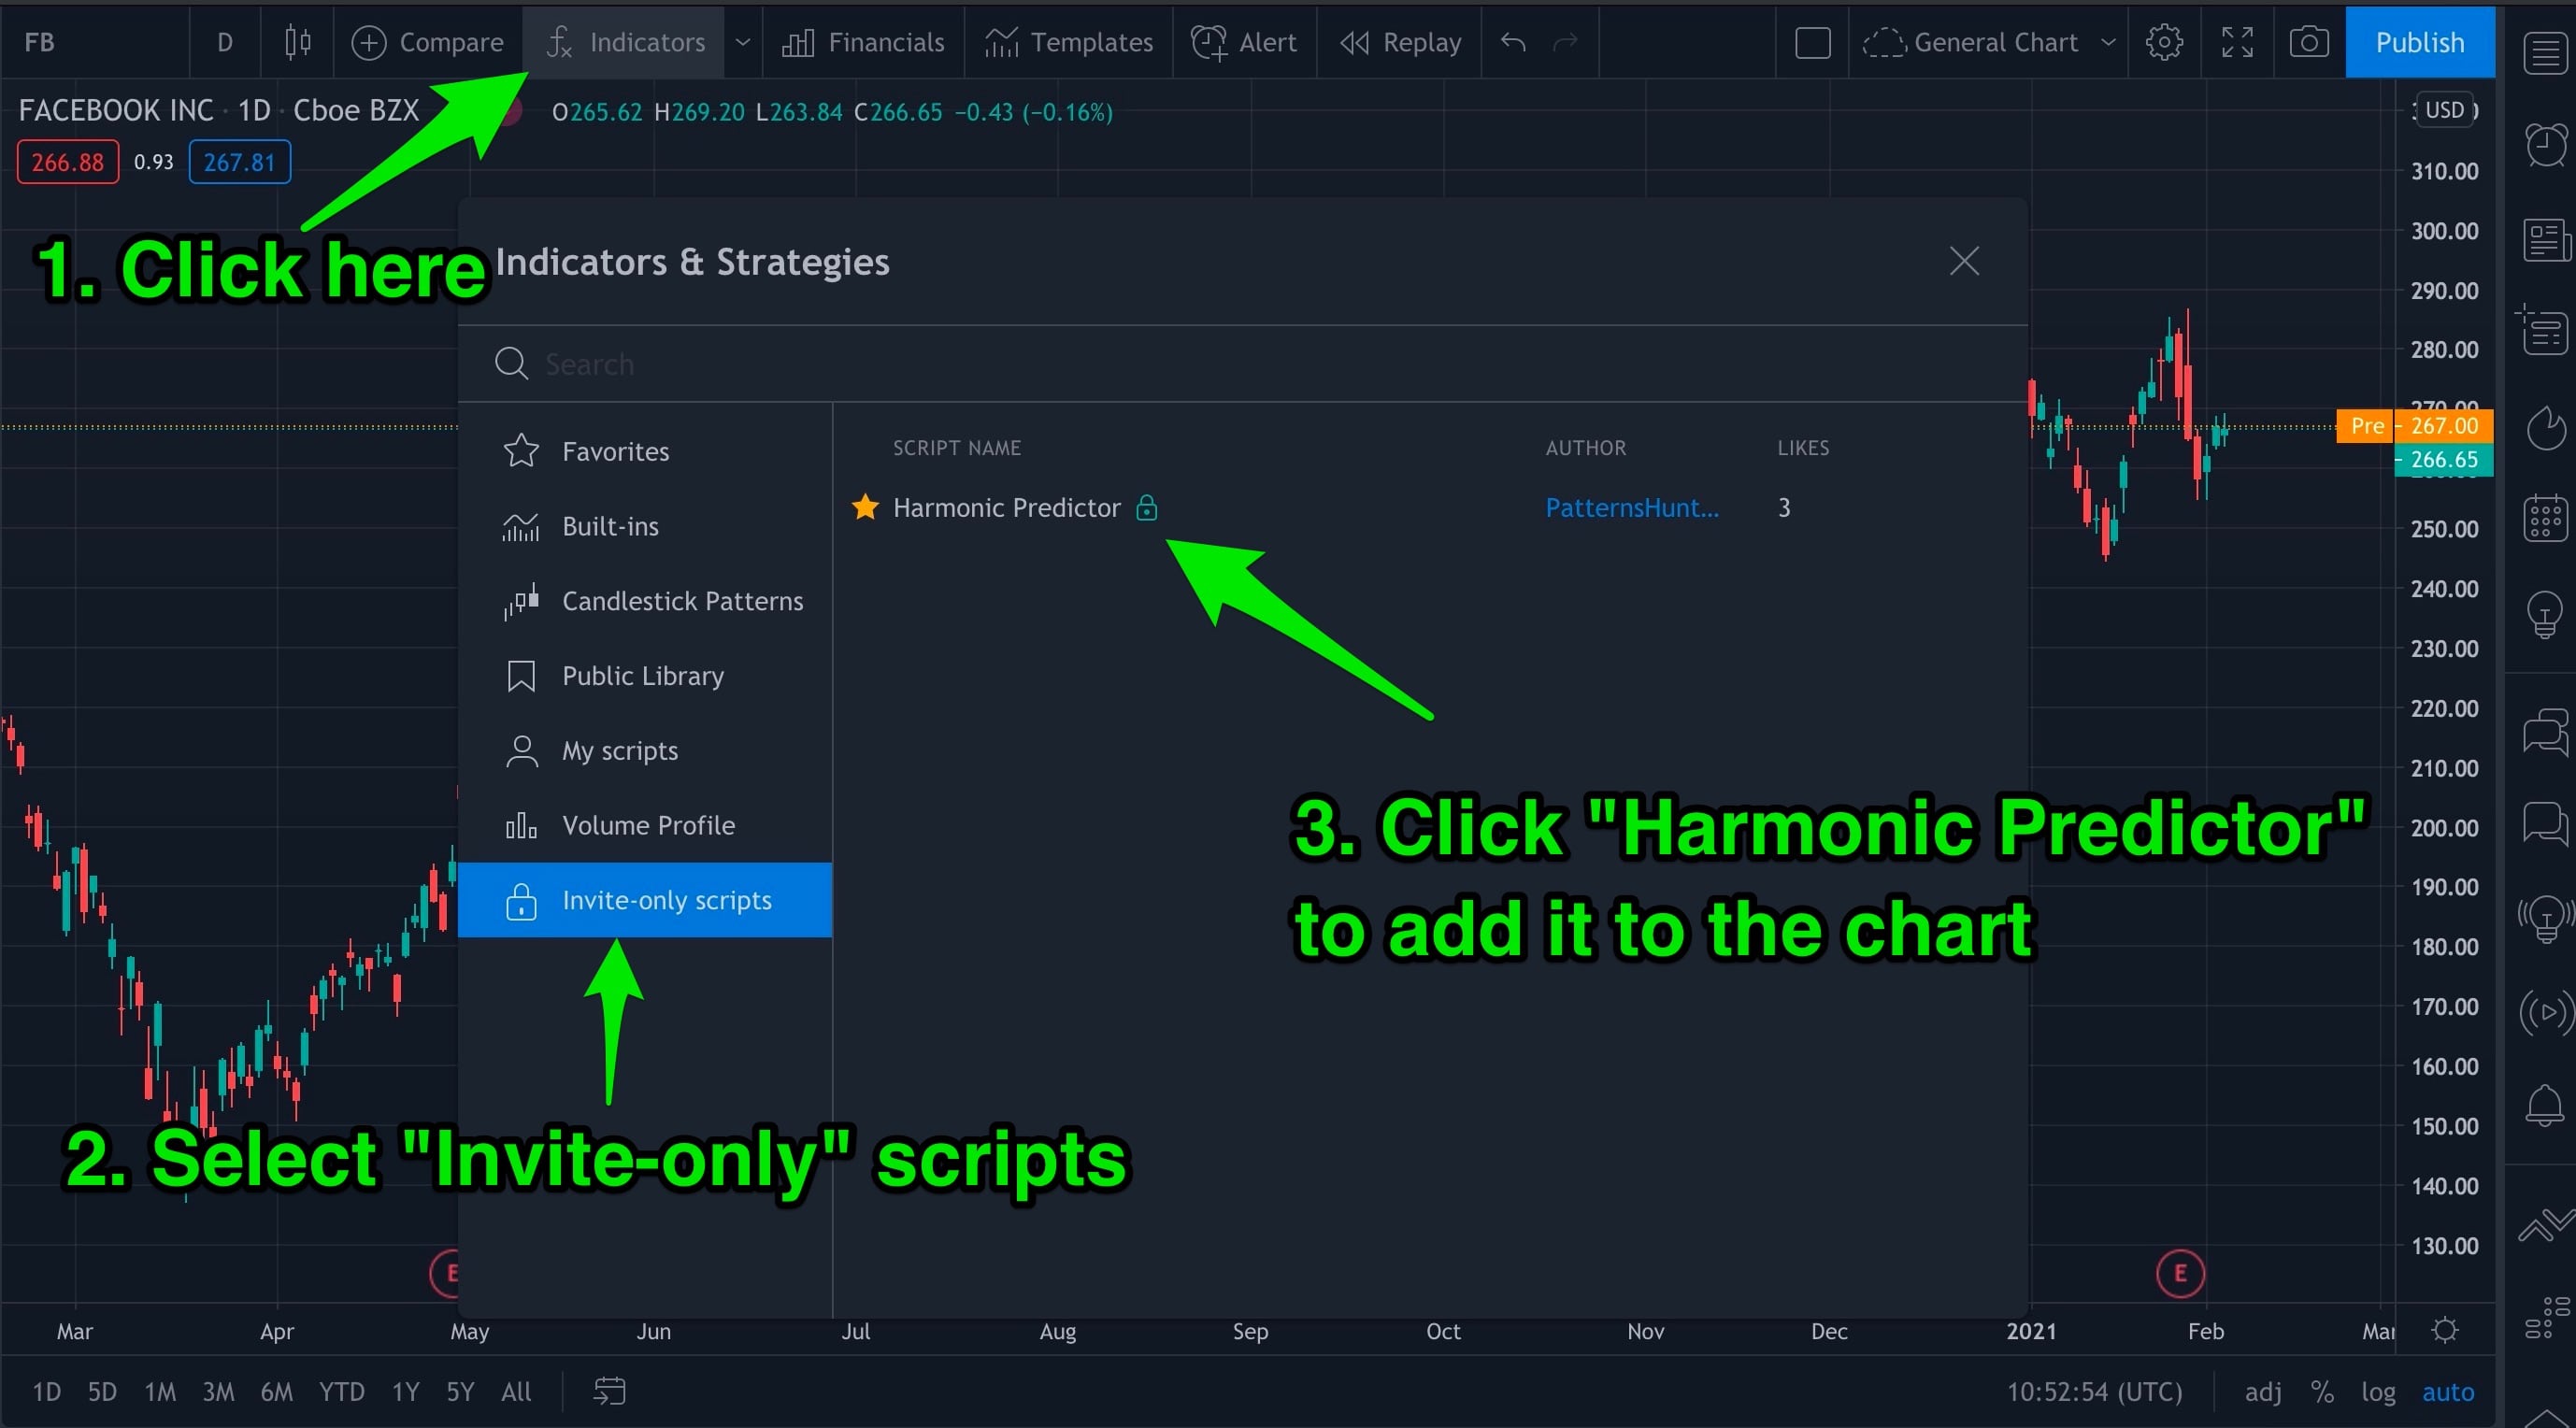
Once you buy the script, you will be able to add it to the chart by clicking the "Indicators" button at the top of the chart view.
Now just start browsing stocks (or cryptocurrencies/commodities/ETFs or whatever security you trade). If there is a potential harmonic formation, you will see a line finished with a rectangle. This rectangle shows the possible location of point D + some error margin (by default, it's 5%). So the middle of the rectangle is the "ideal" location of point D, but not every formation is ideal, so we give it a margin of error.
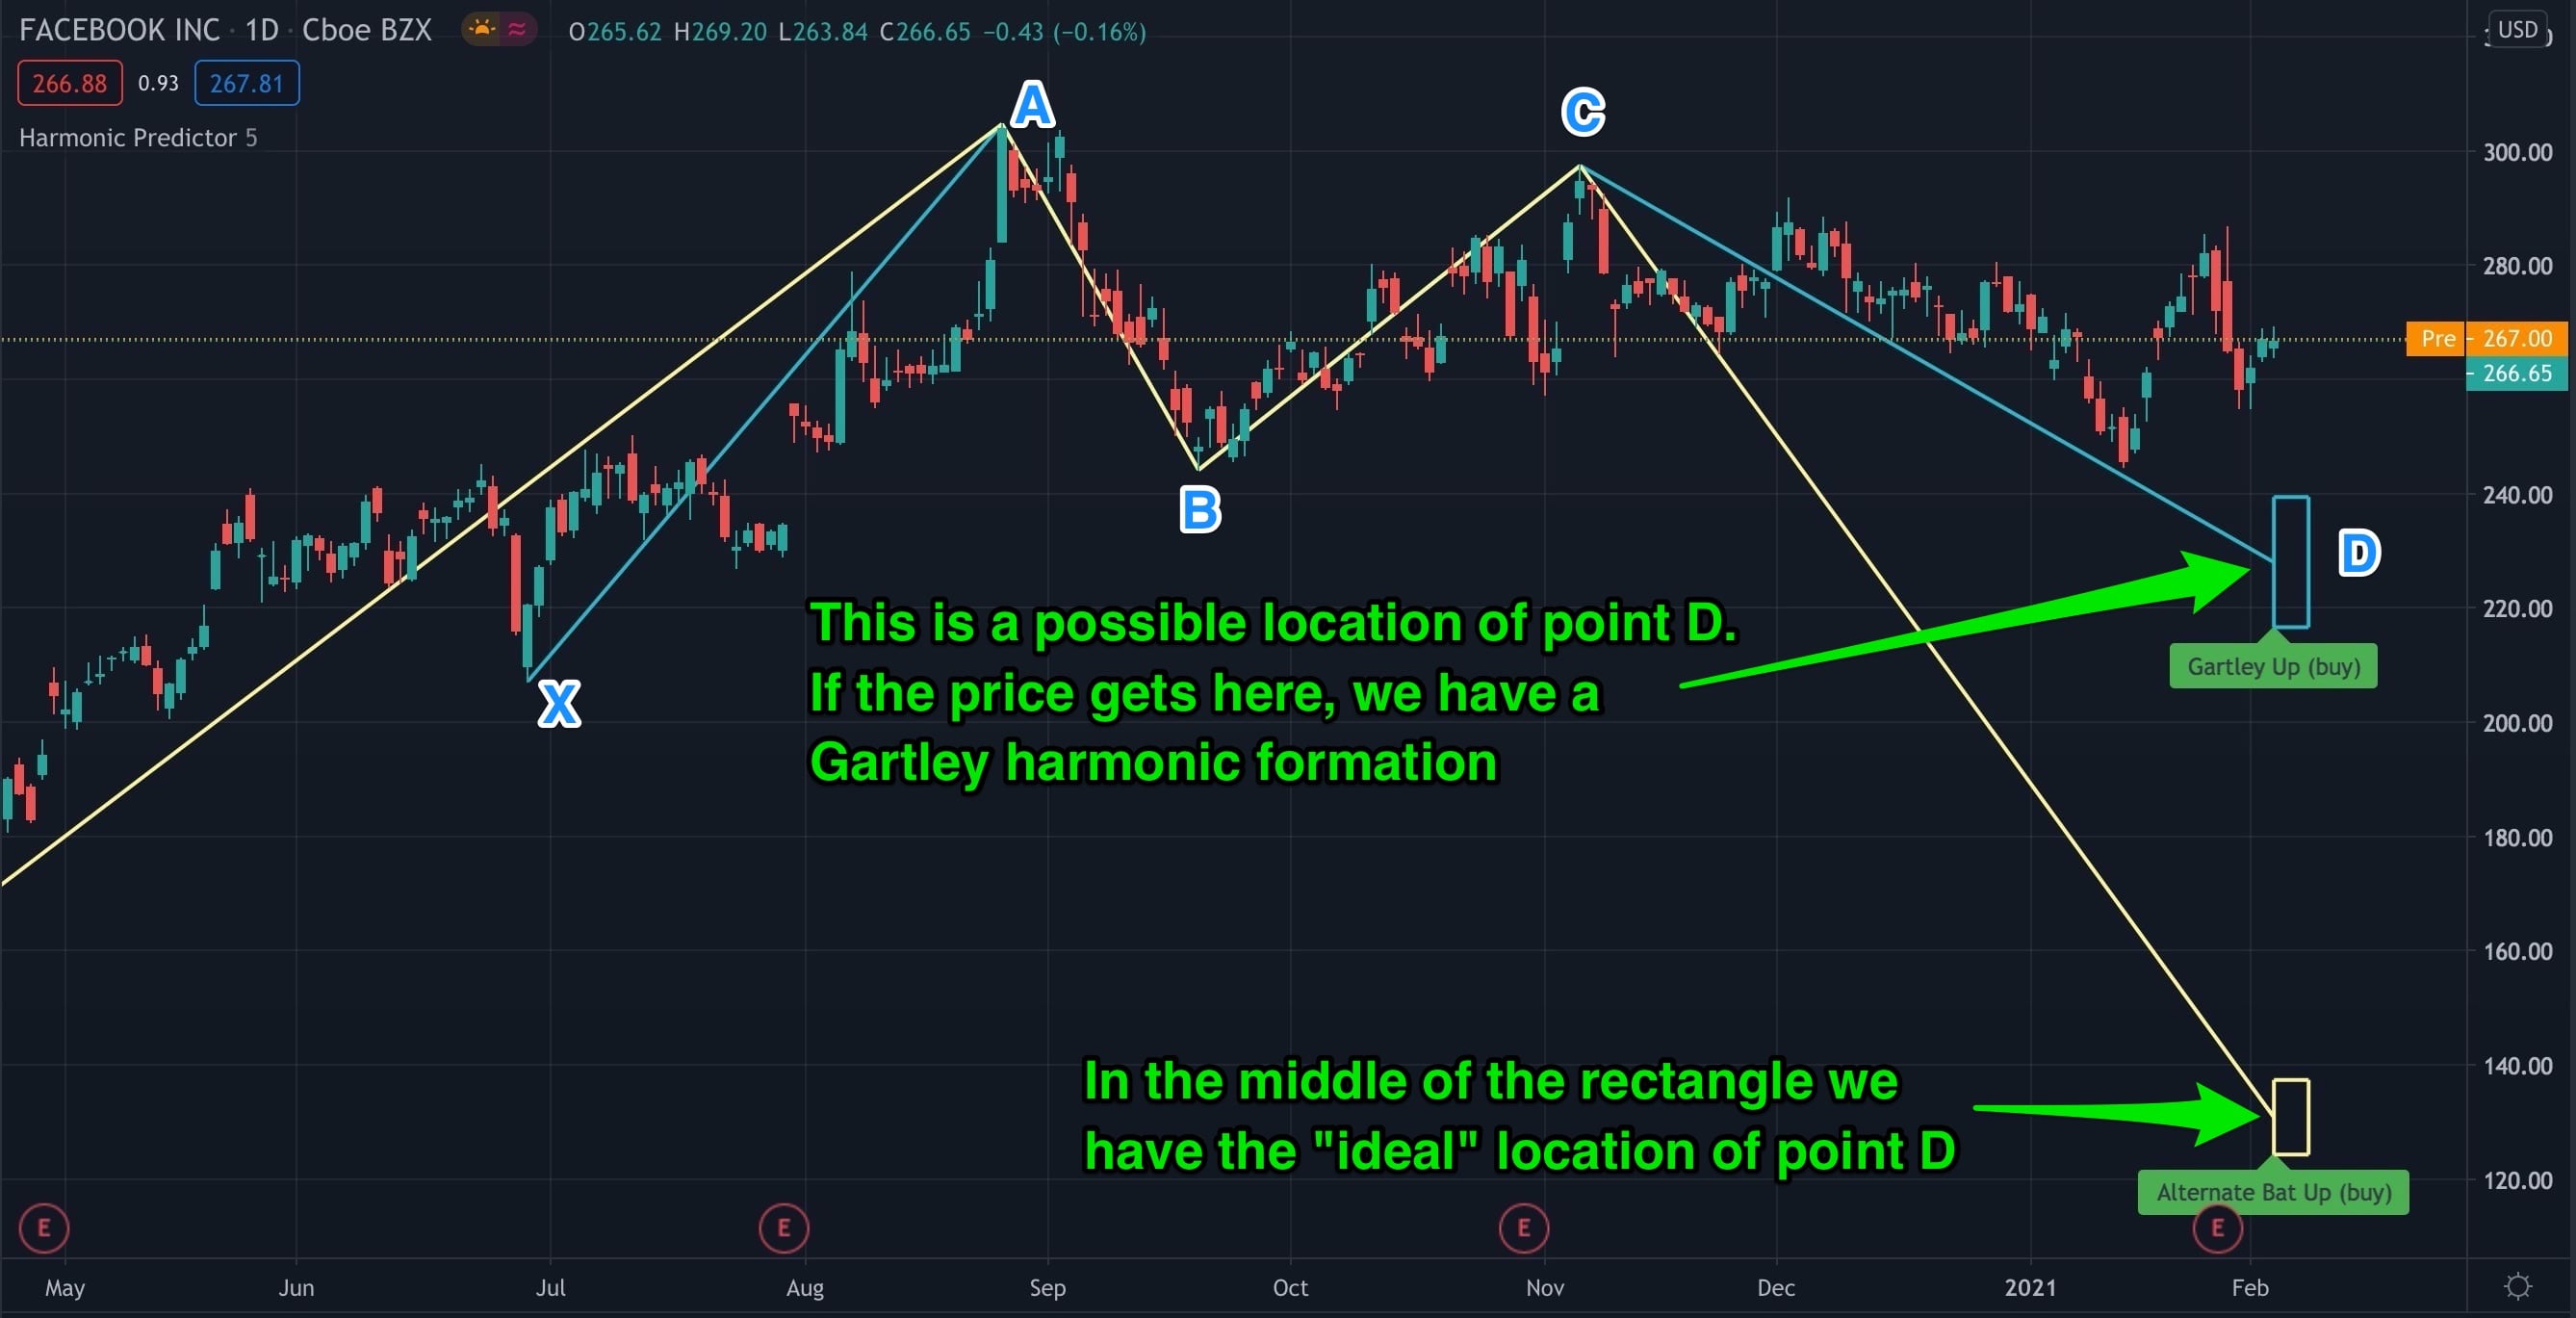
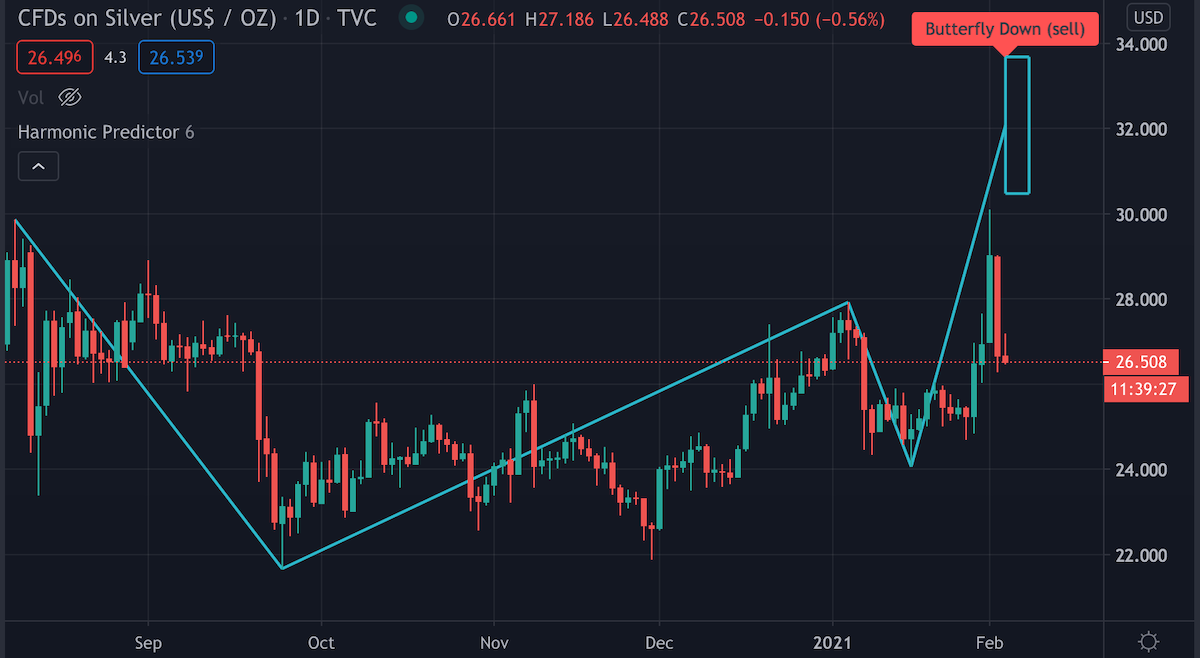
Does the script guarantee that the price will get to that level? Absolutely no! This is just a simulation, and nothing stops the price from going in the opposite direction - thus negating the pattern. As always, make sure you use stop loss and try not to trade against the trend. In the above example, reaching the $220-240 price range is possible, but going all the way down to $120-130 is highly unlikely unless we enter the bull market.
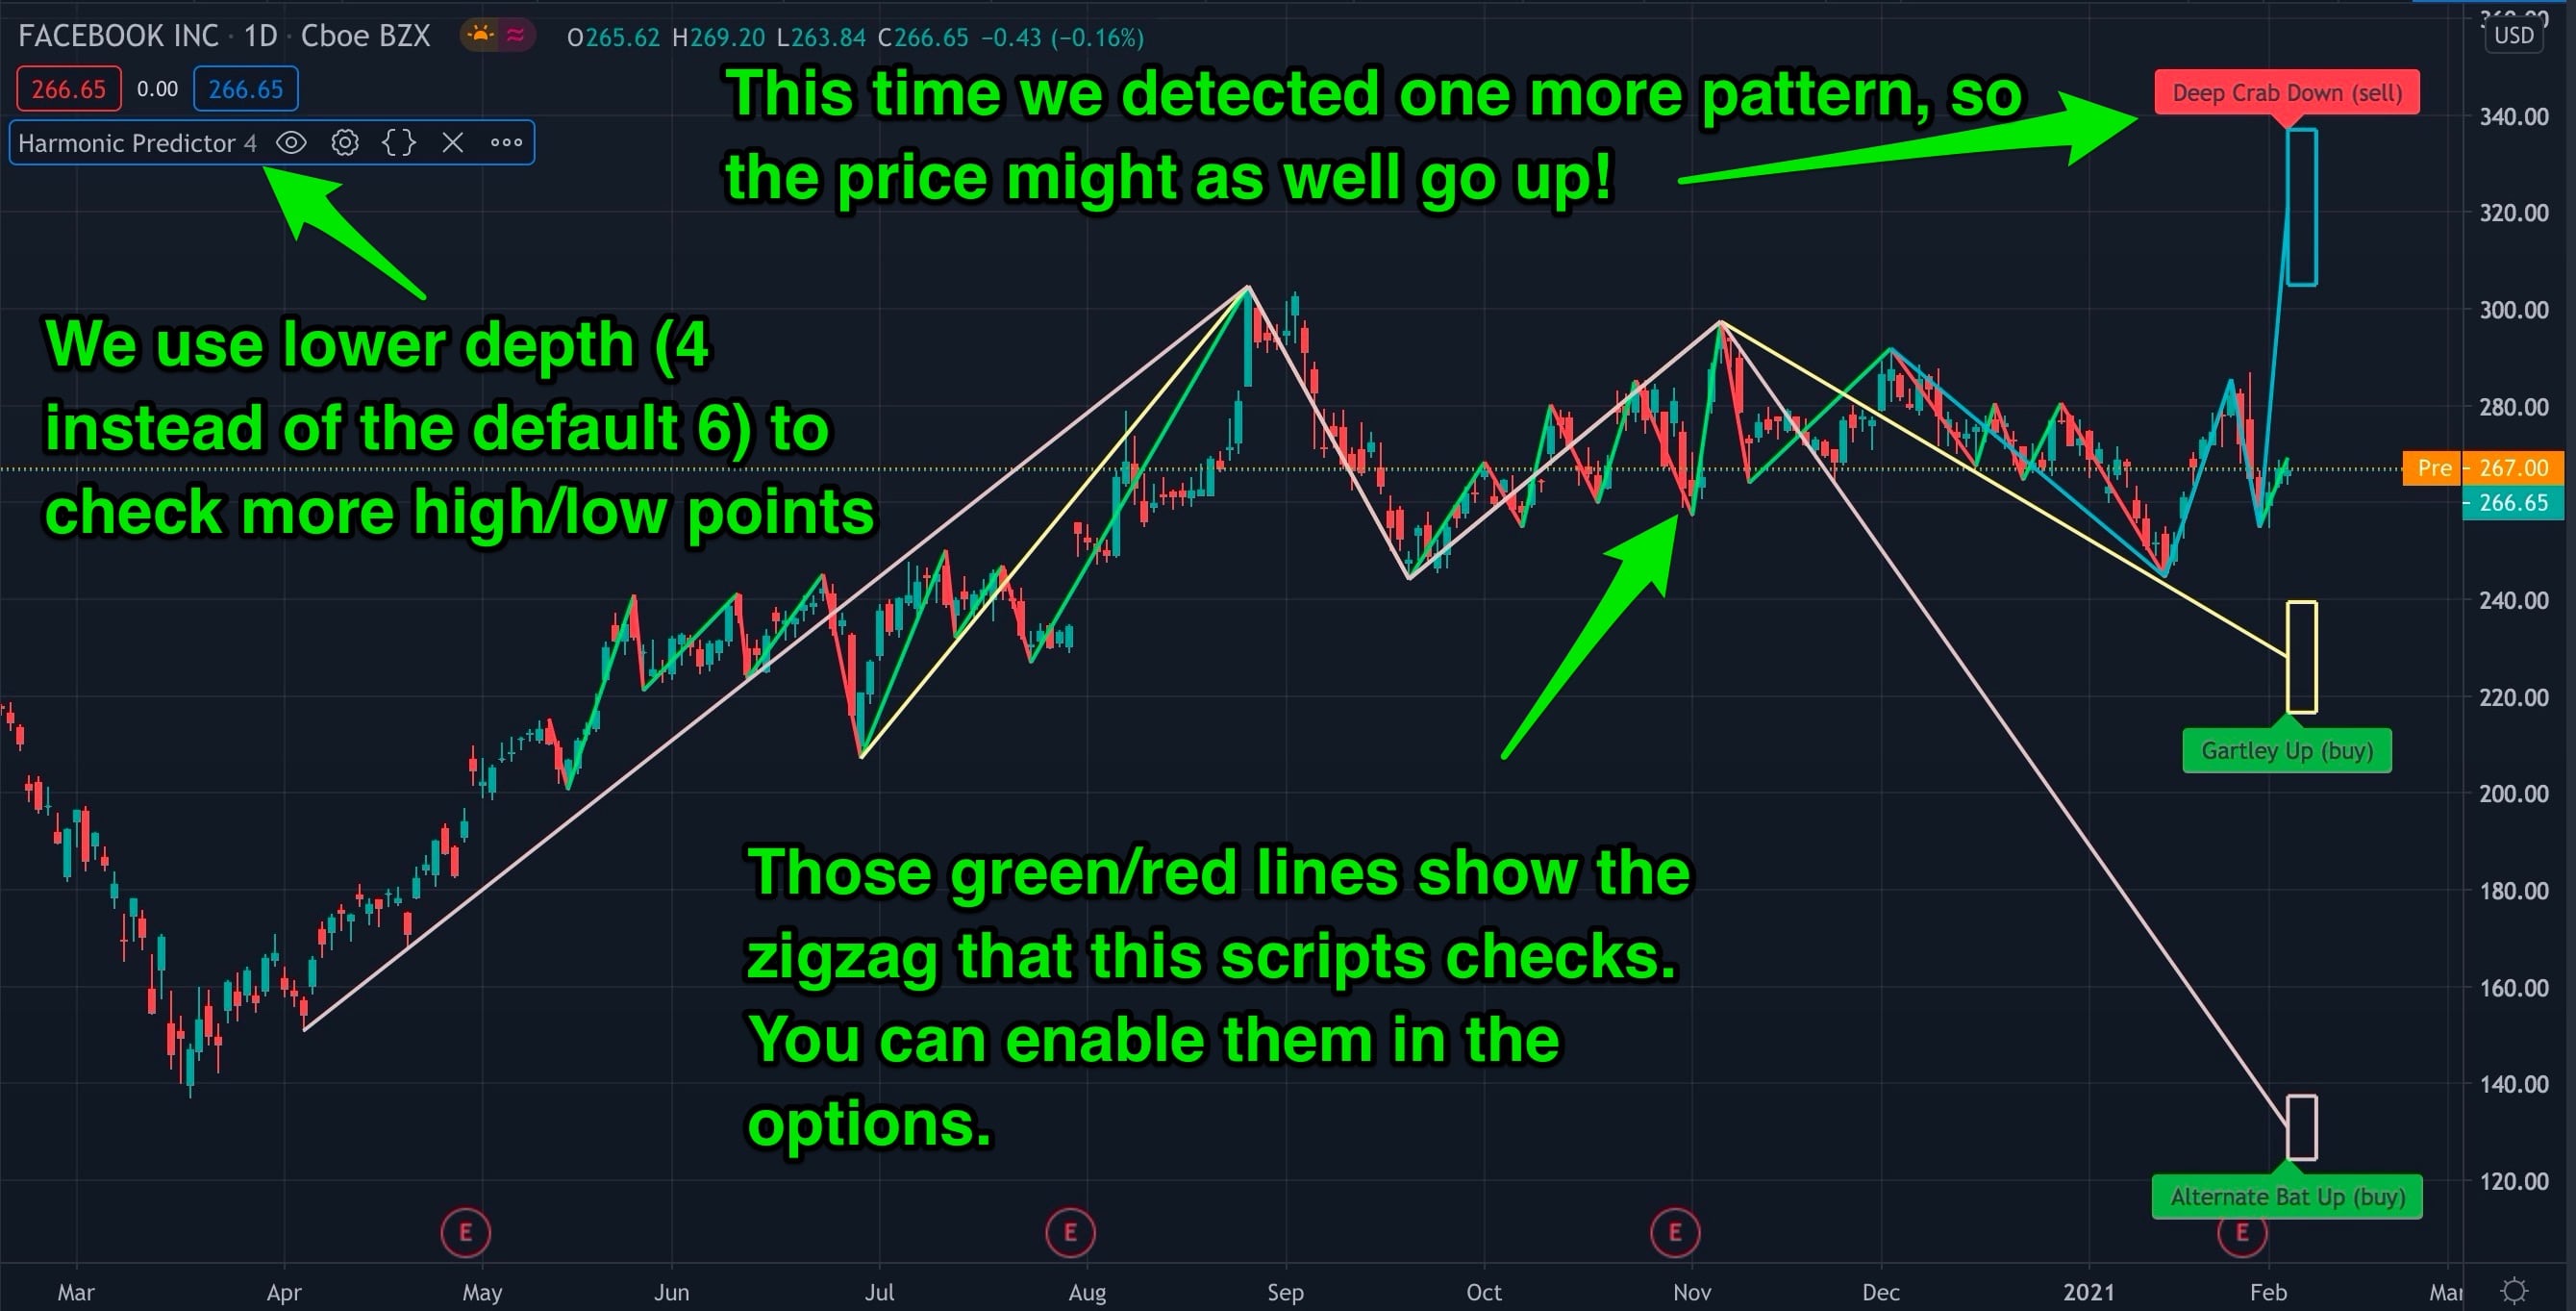
Notice how the number of detected formation changes depending on the depth of the zigzag pattern. Use the configuration options (explained below) to check different zigzag patterns. Remember - high depth means that you only check the "more important" high/low points, so formations that you find there are more reliable. But checking low depth means that you can check more points and can spot additional formations!
You can learn more about pros and cons of using predictions for trading and how this script can help you in the "Can We Predict Harmonic Patterns?" article.
Configuration
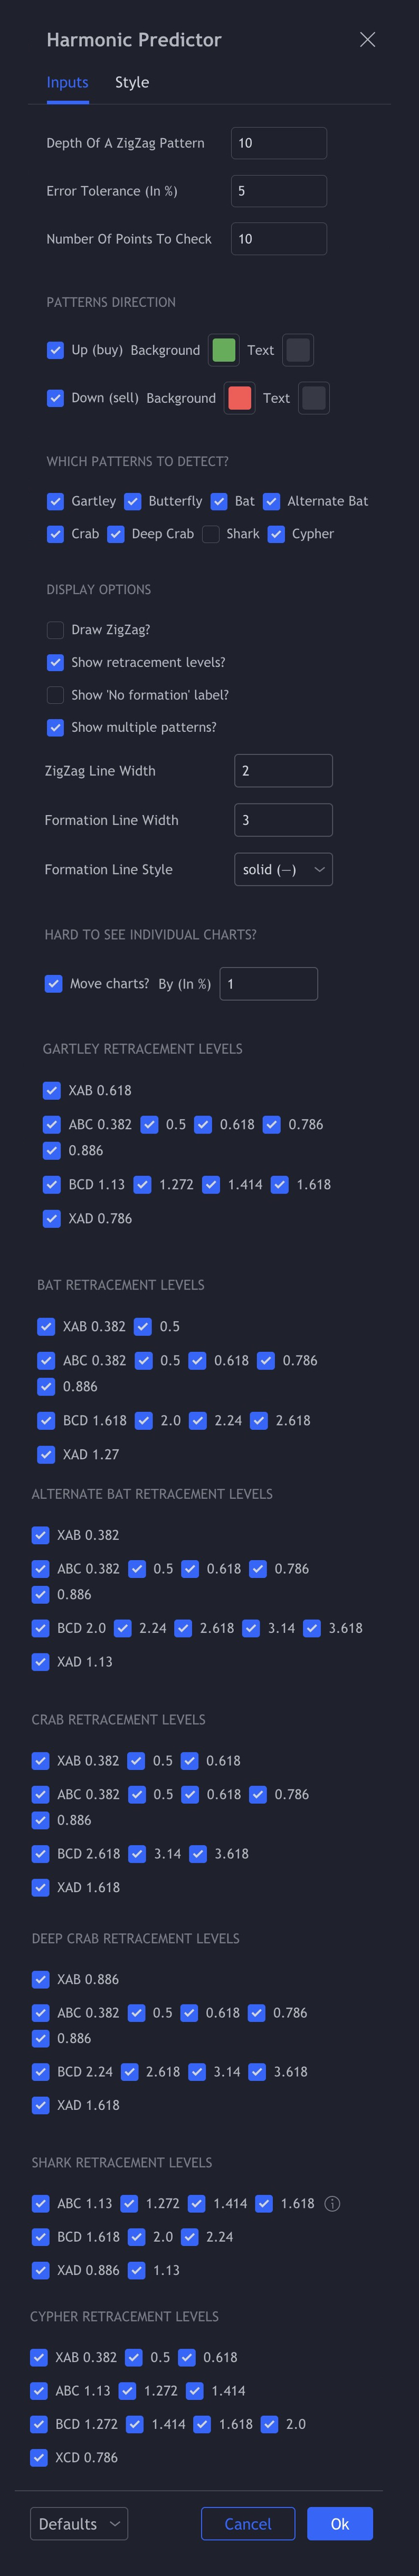
Harmonic Predictor comes with the following configuration options
Depth of a ZigZag Pattern
Select how many previous candles to consider when checking for the high/low points (the zigzag). If you choose a high number, there will be fewer points to check, and the script will be faster. If you choose a low number, the script will be slower, but it will check more points. To see which high/low points are checked, enable the "Draw ZigZag" option.
Error Tolerance (In %)
How much the detected pattern can differ from the "ideal" pattern. With a 5% error tolerance, if the "ideal" retracement is equal to 0.618, we accept a retracement between 0.5871 and 0.6489. Not sure what a retracement is? Check out the "What Are Harmonic Patterns?" article.
Number of Points to Check
Select how many past high/low points you want to check for point C. The higher number you choose, the slower this script will work. If you choose a number too big, you might get an error (TradingView scripts have to finish within a specific time). If that happens, lower the number of points to check or increase the "Depth of a ZigZag Pattern."
Patterns Direction (Up/Down)
Choose whether you only want to see "buy" or "sell" signals (or both). You can also adjust the label (background) and text color in case the default colors are hard to read.
Which Patterns To Detect?
If you are only interested in seeing specific harmonic patterns, you can disable the others.
Draw ZigZag?
When enabled, it displays the zigzag pattern (a line that connects the high and low points). Those are the points that we check to find the harmonic patterns. This option is useful for calibrating the zigzag's depth or seeing what points were checked.
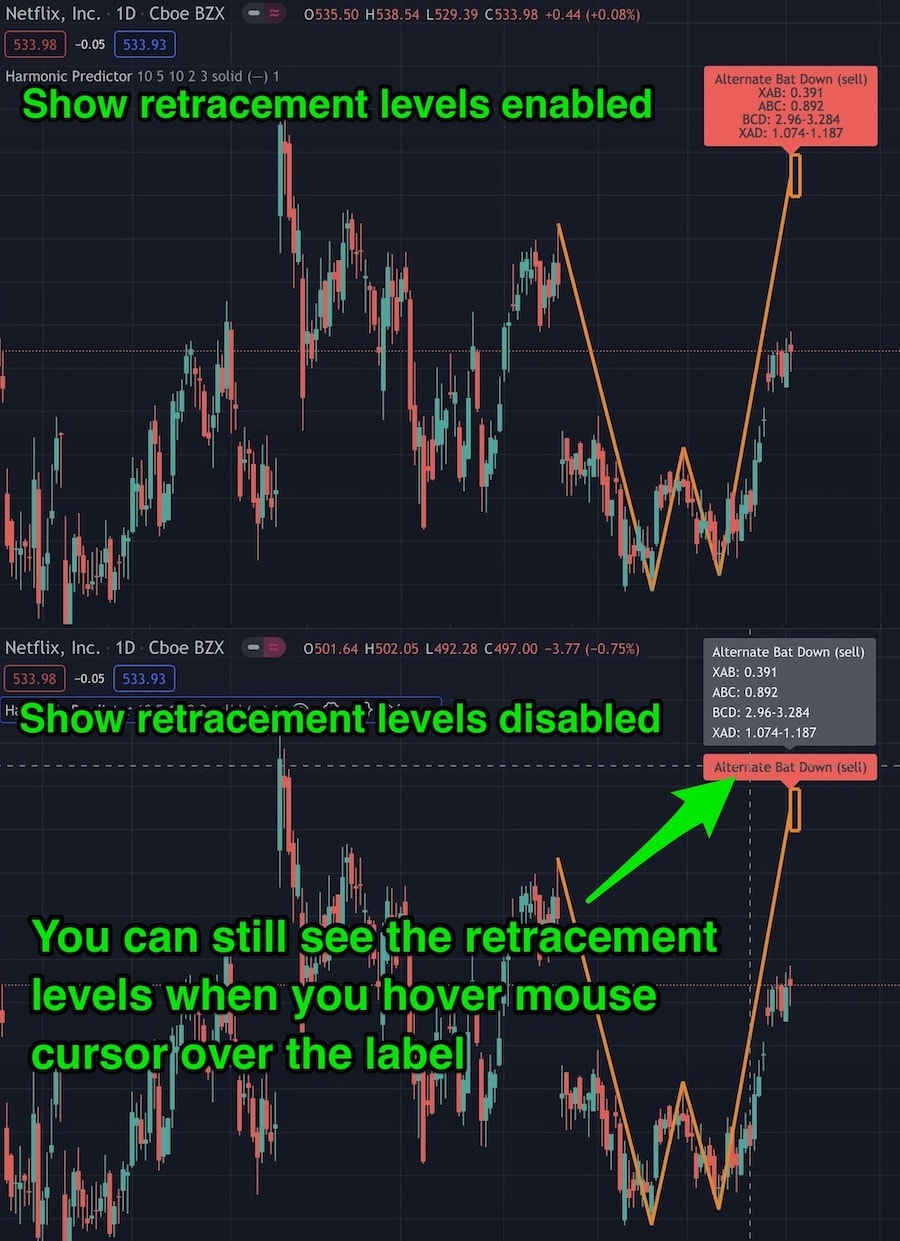
Show retracement levels?
When enabled, it shows the retracement values for each pattern leg (XAB, ABC, etc.) in the label under the pattern name. Retracement values can also be displayed when you hover your mouse cursor over the label with the pattern name (no matter if the "Show retracement levels?" option is enabled or disable). This is useful when labels are hard to read because they are on top of each other.
Show 'No formation' label?
Whether or not you want to display the 'No formation" labels.
Show multiple patterns?
If there are multiple patterns of the same type (for example, two Butterfly patterns) and you enable this option, all of them will be displayed. Sometimes you will see multiple patterns based on very similar points, which is not helpful. If you see too many similar patterns on the chart, disable this option.
ZigZag/Formation Line Width
Width of the lines on the chart - it's a purely cosmetic option.
Formation Line Style
Select a solid (—), dotted (⋯), or dashed (--) line style for the predictions. This is useful when you display the actual patterns (using our Harmonic Scanner script) together with predictions and you want to easily distinguish which is which.
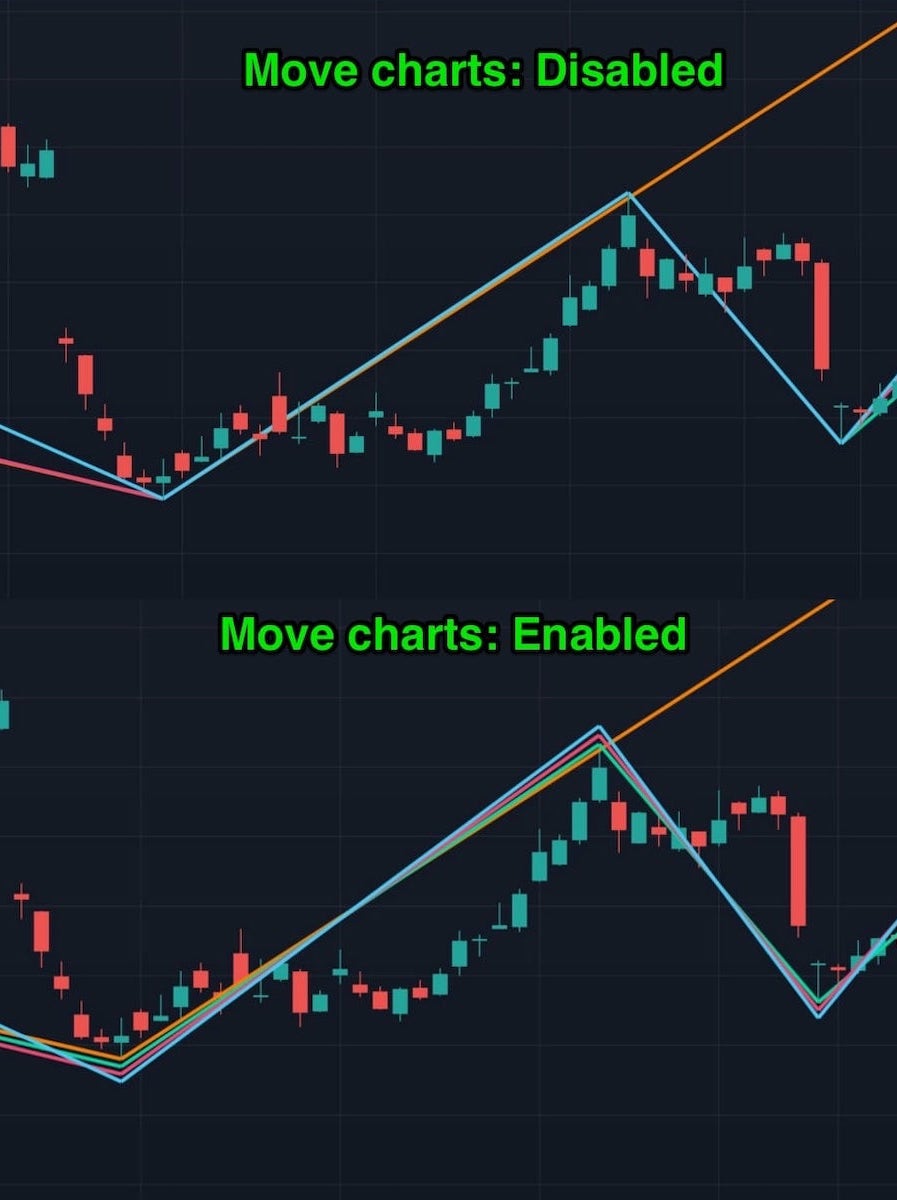
"Move Charts?"
If different patterns share the same points (and often they will), you will only see one of the lines (the topmost one).This makes it harder to see how each pattern looks like, especially when there are many patterns. Enable "Move Charts" to move each line a bit. That way, you will see all the lines separately.
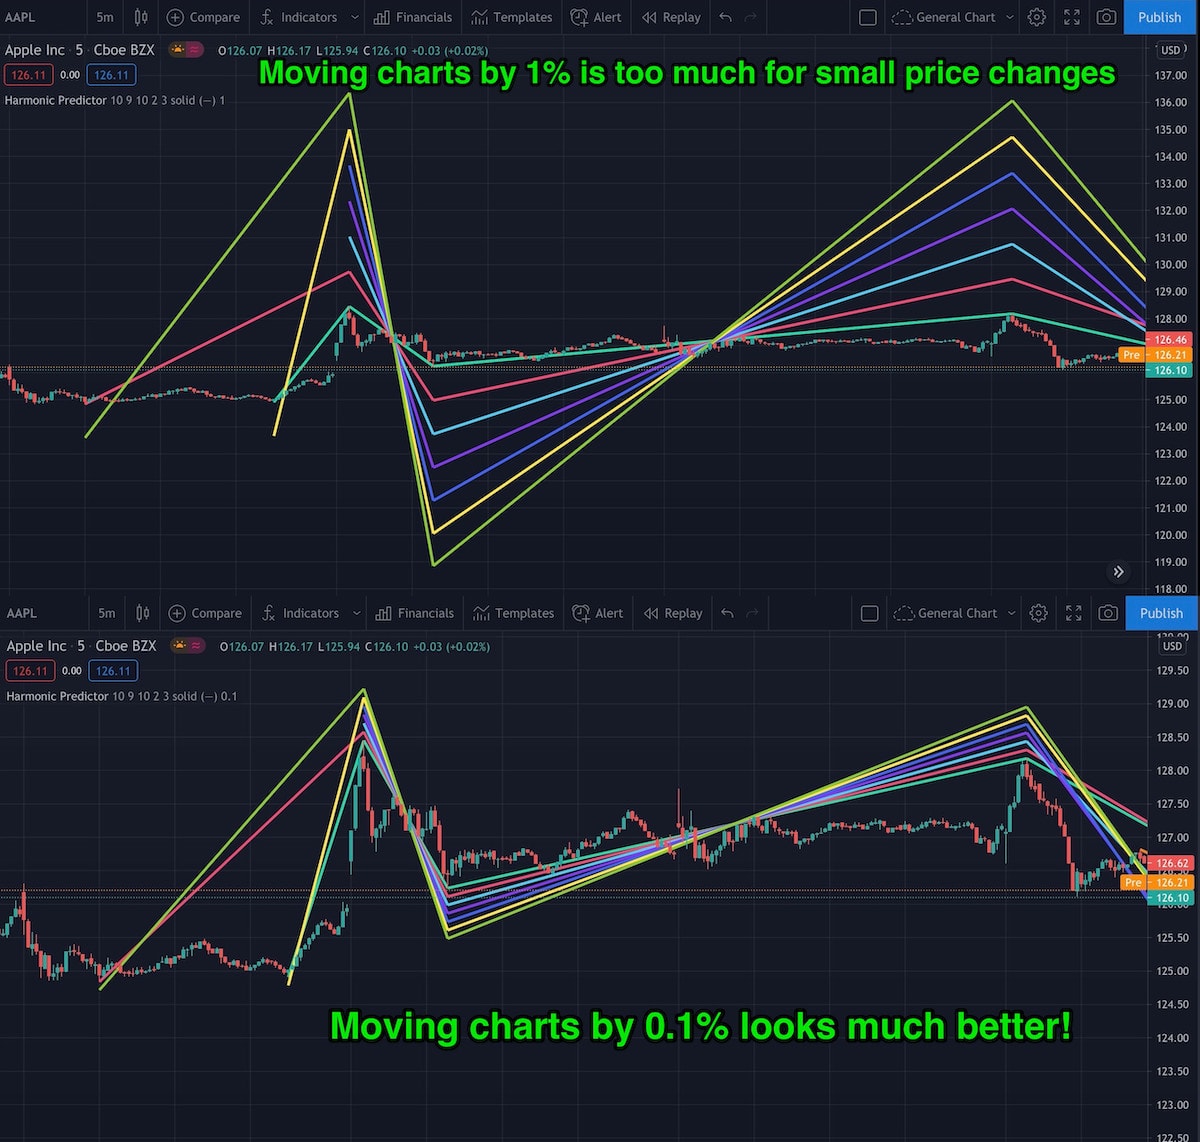
You can also select how much you want to move each line (in a percentage of the current price value). For an hourly, daily, or weekly time interval, the default value of 1% looks fine. But if you use smaller intervals where the price changes are much smaller, the default values will move charts a lot, so you might want to lower this setting. See the images below for a graphical explanation.
Gartley/Butterfly/Bat... retracement levels
Here you can disable retracement levels that you don't want to check. For example, maybe you are looking for a "Perfect Bat Pattern" (described in "Harmonic Trading Volume 1" by Scott Carney). To find only the "perfect bats," enable the 0.382 retracement level for XAB, 0.5 and 0.618 for ABC, 2.0 for BCD, and 0.886 for XAD leg (and disable all other retracement levels for Bat pattern).
Those checkboxes let you really configure the script to your exact needs (especially since different books/websites suggest using different retracement levels). Just keep in mind that if you disable all checkboxes for a given retracement (for example, you uncheck "BCD 1.13", "1.272", "1.414", "1.618" for the Gartley pattern), the script will no longer detect that pattern (so at least 1 checkbox has to be enabled!)
For the Shark pattern, we assume that the formation points are named X,A,B,C,D - just like all the other formations, and not 0,X,A,B,C like in some literature.
Frequently Asked Question
I've added the script to my chart, but nothing has changed. Does it work?
If there is no harmonic pattern, then nothing will be drawn on the chart. Harmonic patterns are rare. They don't appear on every chart all the time. You can display the zigzag pattern to see what points were checked and change the depth of the zigzag to check more or fewer points. See the configuration options above.
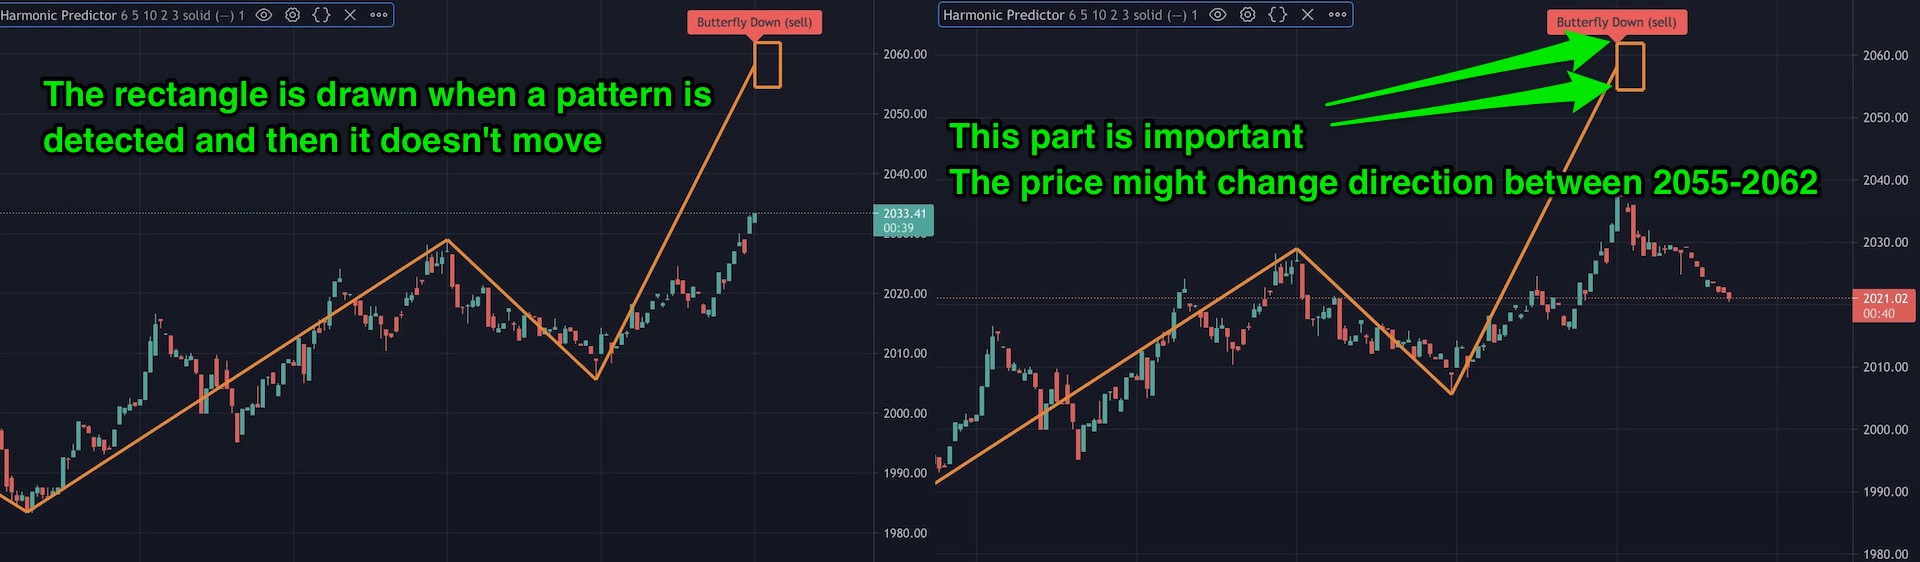
The prediction rectangle doesn't move. Is it stuck?
When the script finds a possible harmonic pattern, it will draw a rectangle of the "potential reversal zone" (price target where the price might change direction). This rectangle starts at the most recent bar on the x-axis and spans 5 bars ahead. Those 5 bars are only a guideline value! It doesn't mean that the price will reach that potential reversal zone within 5 bars. It might get there in the next hour, day, week, or maybe never (then the formation is negated). The width of this rectangle doesn't matter, and it's there just for reference. The important part is the height of the rectangle (the y-axis). It defines the range of the potential price reversal zone.
The existing rectangle is not updated with each new candle. But when you refresh the chart, it will be moved to the most recent bar.
Why is the Shark pattern prediction disabled by default?
Shark pattern has the most "flexible" requirements of all the patterns. Because of that, you will see a lot of Shark predictions. Don't get too excited, though - many of them will never materialize. We disabled it by default so you can focus on patterns that have a much higher probability of appearing. But feel free to enable it in the configuration if you want.
How do I cancel my subscription?
All subscriptions are managed through the Gumroad website. When you buy access to the script, you will get an email containing a link to cancel your subscription. You can also just send us an email, and we will cancel it for you.